Contents
Overview
Load balancing with Microsoft Azure comes in three categories; Azure Load balancer (Network load balancer), Application Gateway(Application Load balancer), and the Traffic Manager(DNS load balancer). Azure being cloud-native and able to serve traffic between on-premise infrastructure makes it ideal. However, there are lots of downsides when using Azure for load balancing, and a few of these include:
- Complexity: Azure Load Balancer adds complexity to the overall application architecture. For example, you may need to set up and manage multiple load-balanced resources, configure health probes and load-balancing rules and place them in a single Resource Group. Configuring these resource groups requires high technical expertise, and if not handled efficiently, some systems might break down.
- Limited customization: Azure Load Balancer provides a set of limited load-balancing algorithms and health probes. If you need more customization, look for other options, such as ZVNcloud.
- Dependency on Azure: If you are using Azure Load Balancer to load balance traffic between on-premises and Azure resources or between Azure regions, you will be dependent on Azure infrastructure and services. This can be a concern if you aim to minimize your reliance on one cloud provider.
Read more about ADC comparison between ZEVENET and Microsoft Azure in this article: Microsoft NLB and ZEVENET Comparison.
Prerequisites
One must meet these basic requirements to transfer configurations from Azure to ZEVENET‘s fully featured ADC.
- An instance of ZEVENET ADC must be installed on your PC, bare-metal, virtual environment, or one must have an active ZVNcloud account. Request an evaluation for on-premise deployment.
- One must have access to the Web graphical interface. If you don’t, follow this quick Installation guide.
- One must be a current user of Microsoft Azure and is familiar with the concepts we will discuss in the section below.
- One must be able to create a virtual server in the ZEVENET load balancer. Here is a quick guide: Layer 4 and Layer 7 Virtual Server Configuration.
Note
ZEVENET has a template in the Azure Cloud marketplace under the BYOL license. The deployment of ZEVENET on Azure clouds is seamless and shouldn’t raise any concerns.
Basic concepts
Health probe: A health probe is a functionality used by Microsoft Azure to check whether a Virtual machine instance is up and the service running on it is healthy. These mechanisms function by sending ICMP and Protocol specific requests to these Instances, and in response, they receive a 200 Ok status code showing the service is functioning normally. ZEVENET uses the Farmguardian functionality to monitor the health status of Backends.
Azure Load balancer: Azure Load Balancer functions at layer 4 (TCP/UDP). To Create a Layer 4 load balancer in ZEVENET ADC, one must create an LSLB Farm with an L4xNAT profile.
Application gateway: The application gateway enables one to manage Layer 7 traffic by implementing security features like SSL termination and a Web Application Firewall(WAF) to protect an application or databases from malicious attacks like SQL injection or Cross-site scripting(XXS). To create a Layer 7 load balancer in ZEVENET ADC, one must create an LSLB Farm with an HTTP profile.
Traffic Manager: The Azure Traffic Manager enables an admin to control the distribution of traffic across multiple service endpoints in different regions. This module uses DNS to direct client requests to the most appropriate endpoint based on the configured routing method and the current status of the endpoints. ZEVENET ADC uses the GSLB Farm to route traffic to various data centers located in different geographies.
Backend pool: A backend pool is a group of resources one may use as the destination for incoming load-balanced traffic. These resources are mainly virtual machine instances with the code serving requests from the clients over the web. A backend pool is the same as a Service in ZEVENET ADC.
Virtual machine instance: A virtual machine instance is the endpoint/destination server where client requests from the web are processed. These servers are known as Backends when using ZEVENET ADC.
Resource group: A resource group is a collection of resources within Microsoft Azure. These resources could be health probes, virtual networks, virtual machine instances, etc. When using ZEVENET ADC, there is no need to create a resource group as all the resources to create a fully functional load balancer are integrated within the ZEVENET ADC. The entire appliance itself is a collection of resources.
Example configurations: DDoS Protection
DDoS attacks are scary! One can never know when a Botnet swarm attacks. But what we are sure of is they aim to take the entire system down by overwhelming it with a flood of requests. These requests could be from desktops, servers, IoT devices, or any device hackers can get their program to latch on. Since this swarm may arise with millions of devices, it is often difficult to separate legitimate users from bots, especially for an HTTP flood attack.
ZEVENET ADC is designed with DDoS protection with the aim of fighting attacks like SYN-FIN flood attacks, Ping of Death, HTTP flood, ICMP(ping) flood, and many other sophisticated DDoS attacks. If using Microsoft Azure, you may realize the DDoS protection plan is out of your budget and unpredictable, hence switching to a more stable plan with ZEVENET ADC. In this section, we will discuss how to set up DDoS protection in ZEVENET ADC in comparison to Microsoft Azure.
Microsoft Azure configurations
To get DDoS protection for a specialized virtual network, one must pay for a separate DDoS plan, and he/she must use this plan witfully as the bills could stack up easily.
- Within the Azure search bar, type DDoS protection.
- Click on DDoS Protection Plan.
- One must click on the Create button to add a DDoS protection plan.
- Select a subscription plan for your virtual network.
- Select a resource group in which your network is in.
- For Instance details, Enter the instance Name and Region.
- After filling in these details, one must click the Review + Create button.
- Assuming you have already configured a virtual network in Azure that you want to monitor, Navigate to the Virtual network that you created.
- Click on the DDoS protection Settings of that network.
- By default, the DDoS protection standard plan is disabled. One has to click the Enable radio button.
- Select the DDoS protection Plan and click the Save button.
ZEVENET Configurations
- To create DDoS protection in ZEVENET ADC, Go to the IPDS section on the menu and click to expand it.
- Click on the DoS Option.
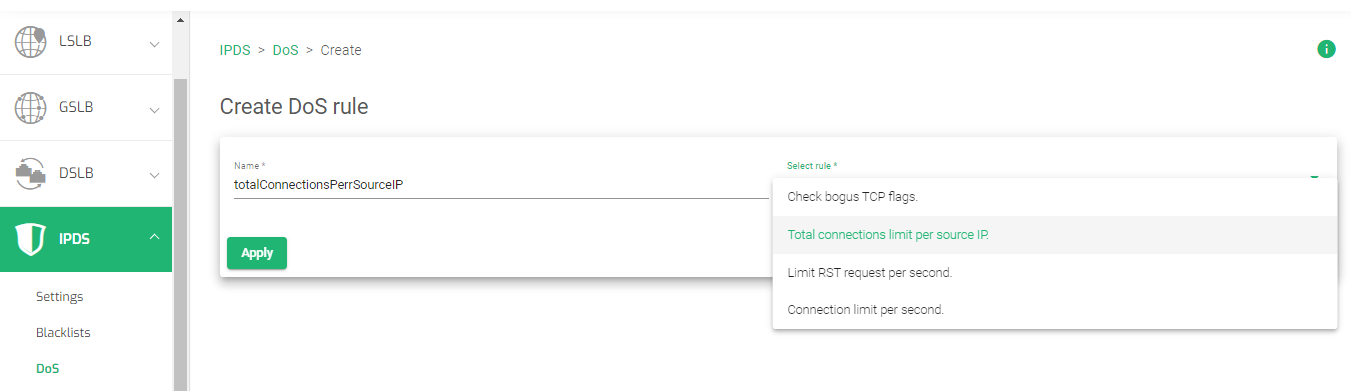
- Click on the Create DoS rule button.
- Enter a Name that easily Identifies a DoS rule.
- There are four DoS rules, select a rule. In this example, we will select the Total connections limit per source IP. and click the Apply button.

- Enter the total number of concurrent connection you want the source IP address to have after a single TCP handshake
- Click the Apply button to save the configurations.
- From the four DoS protection rules, you may create the others following a similar process from line 1. These other rules include:
- Check bogus TCP flags
- Total connections limit per source Ip.
- Limit RST request per second
- Connection limit per second.
- After creating any or all of the rules, click the Farms tab within each rule’s settings.
- Drag and drop the Farm(s) you want to apply the rule to from the Available Farms section to the Enabled Farms section.
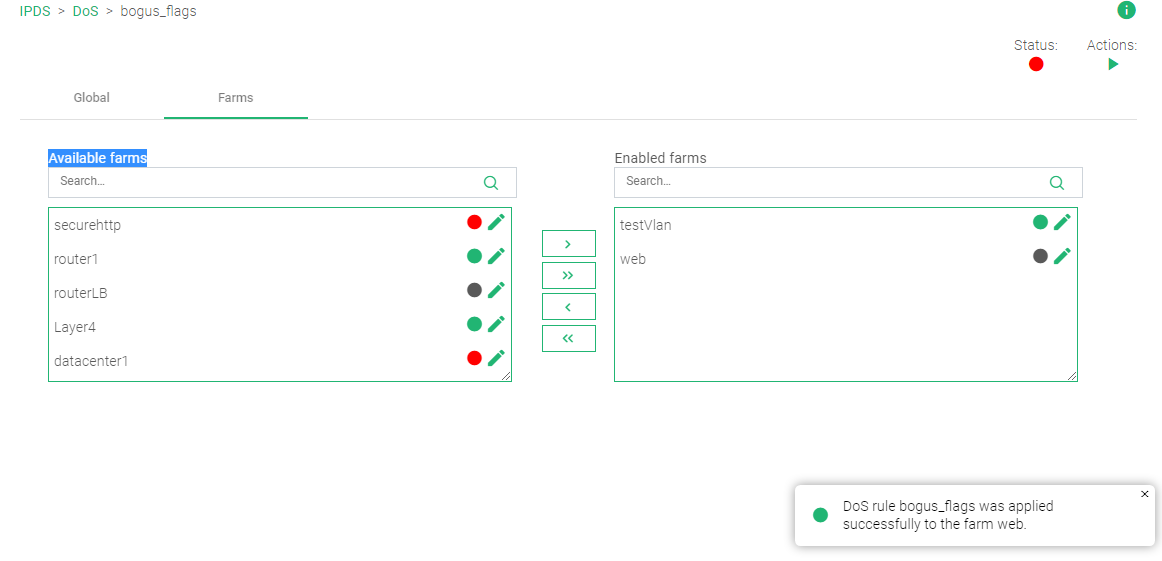
- Within the top right corner, there is the Actions section. Click the Green Play button for the rule to take effect. The Status color indicator will change from Red to Green
Read more about DDoS protection rules in this documentation. IPDS | DoS | Update.
Example configuration: Monitoring and Alerts
You finally set up a private network, a load balancer, a firewall, and health checks. Now what? How do you keep your eyes on the metrics? To keep track of every activity or resource usage within an Application Delivery controller, we must perform data evaluation. We must keep track of the traffic load, CPU and memory usage, activity logs, network logs, etc. Overall, the monitoring system provides a platform for system admins to watch how traffic flows in and out of a private network and if the application servers are functioning efficiently.
The monitoring system is robust, with visualization through graphs, pie charts, bar graphs, etc. Automation of this data may be used to trigger alerts and email notifications in case of any arising security threat.
In this section, we will discuss how to use monitoring graphs to keep track of activity within a network and the applications on it. We will discuss monitoring with ZEVENET ADC in comparison to Azure Monitoring.
Azure monitoring and Alert concepts
In this section, we will discuss more Azure monitoring concepts. In the later section, we will use these concepts to demonstrate Monitoring with ZEVENET ADC.
To enable monitoring in Azure, One must navigate to the Monitoring section. A quick search through the search bar will get you there.
Monitoring data using Azure comes in various formats. That may be through Metrics, Alerts, Activity logs, and System Logs.
The Metrics section collects data from various resources in resource groups. One can set up the monitoring to track network usage, CPU usage, Memory usage, Inbound and outbound traffic, or the average processor speed.
An Alert notifies an admin through sms messages or an email in case unusual activity occurs. This could be a spike in network traffic, brute-force attacks, etc.
Activity Logs help admins track activities like starting, stopping, enabling, disabling virtual machines, changing resources, adding resource groups, etc.
Logs provide details from the core applications. For example, these could be Application logs, database logs, or VM logs.
Let’s use these concepts with ZEVENET to show how you can monitor activity on your load balancer.
ZEVENET Descriptions and configurations
The Monitoring module in ZEVENET ADC presents 3 sections, Graphs, Stats, and Farmguardians.
Graphs
The Graph section shows the graphical visualization of resources used by the Appliance(System), its network Interfaces, and individual Farms configured on the load balancer.
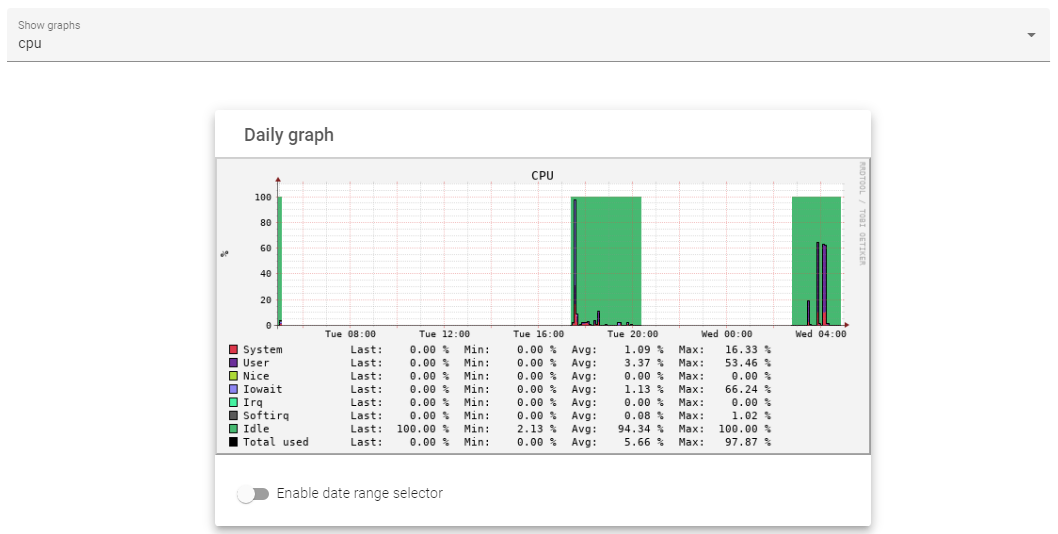
The system graphs show the analytics about CPU, Load, RAM, and SWAP usage. One may view the number of resources utilized within a day, the previous week, month, or year.
The graph shows resource usage by the CPU in the previous 24 hours.
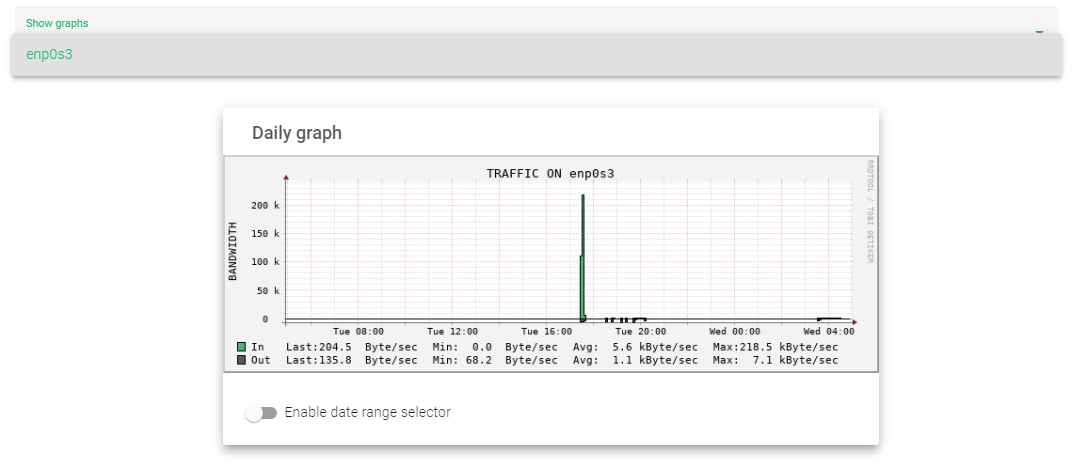
The interface Section displays the quantity of traffic flowing in and out of the load balancer within the past 24 hours, week, month, or year on a selected network Interface.
The graph shows the traffic In and Out through an interface within the past 24 hours.
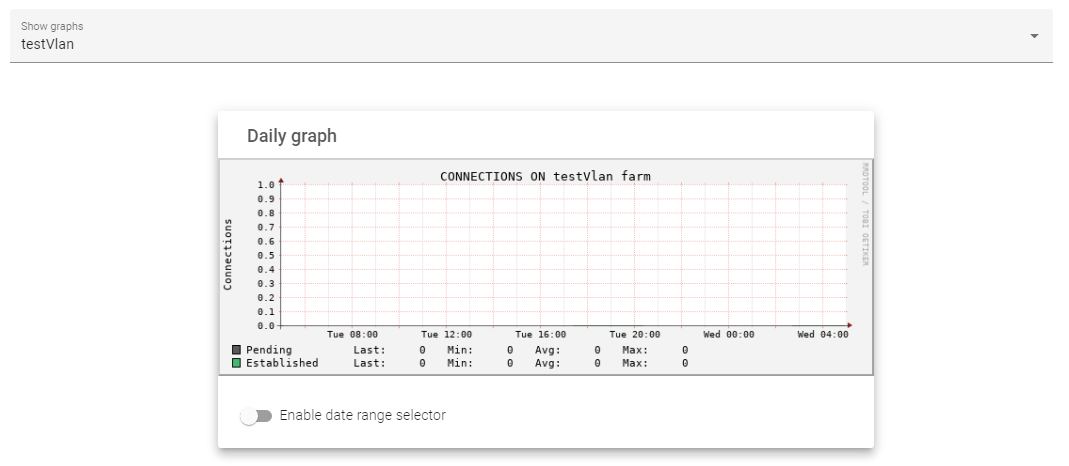
The Farms sections displays the total number of Pending and Established connections to a Farm within the previous day, week, month, or year from a selected Farm.
The graph below shows the total number of Pending and Established connections within the previous 24 hours to a selected Farm.
To get a more in-depth explanation about Monitoring graphs, read this documentation: Monitoring | Graphs
Stats
The Stats section shows the numerical representation of the data shown in the graphs. Here is a more in-depth explanation about Monitoring Stats.
Farmguardian
The Farmguardian section enables one to customize health checks for a particular service on their ADC node.
Let’s demonstrate by creating a custom SIP health check.
- Click on the Farmguardian sub-menu.
- Enter a suitable Name that identifies that health check.
- ZEVENET ADC already has a check-sip health monitor. Click on the Copy farmguardian field and select the check-sip template. If you want to make a completely custom health check that does not exist on the load balancer, leave the Copy farmguardian health check as –No farmguardian–
- Click the Apply button.
- Leave the Command unaltered. For a completely custom health check, enter a custom command to perform the health check
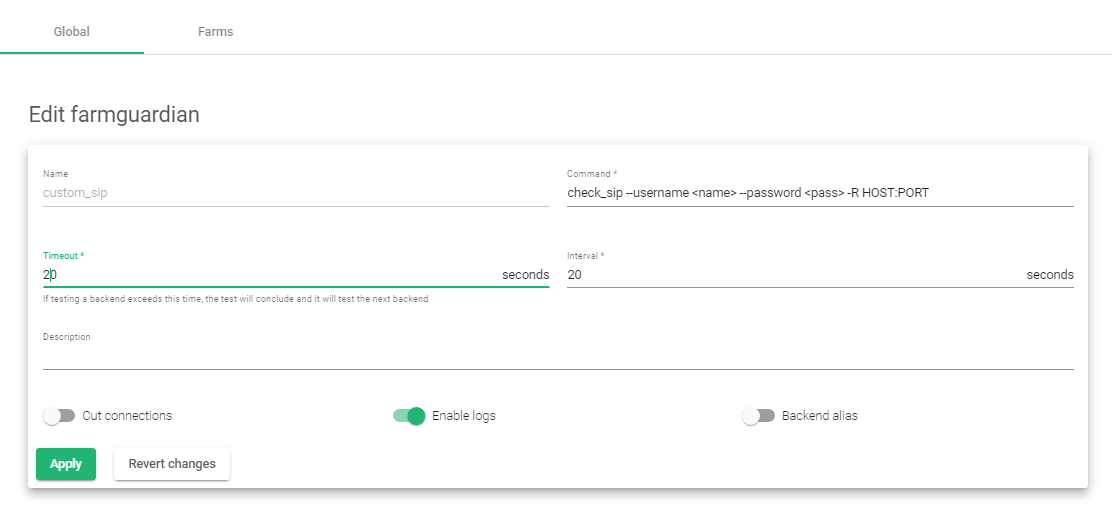
- Edit the Timeout and Interval to a suitable value.
- Click on the Enable logs toggle button.
- Click the Apply button to create a custom health check.
Additional Resources
Web Application Firewall configuration.
Configuring SSL certificates for the load balancer.
Using the Let’s encrypt program to autogenerate an SSL certificate.
Datalink/Uplink load balancing With ZEVENET ADC.
DNS load balancing with ZEVENET ADC.