GSLB Farm Stats
Find all GSLB farm statistics in this section. The stats include both established and pending connections for each GSLB farm.
This is a real-time update on the number of connections shown for each farm.
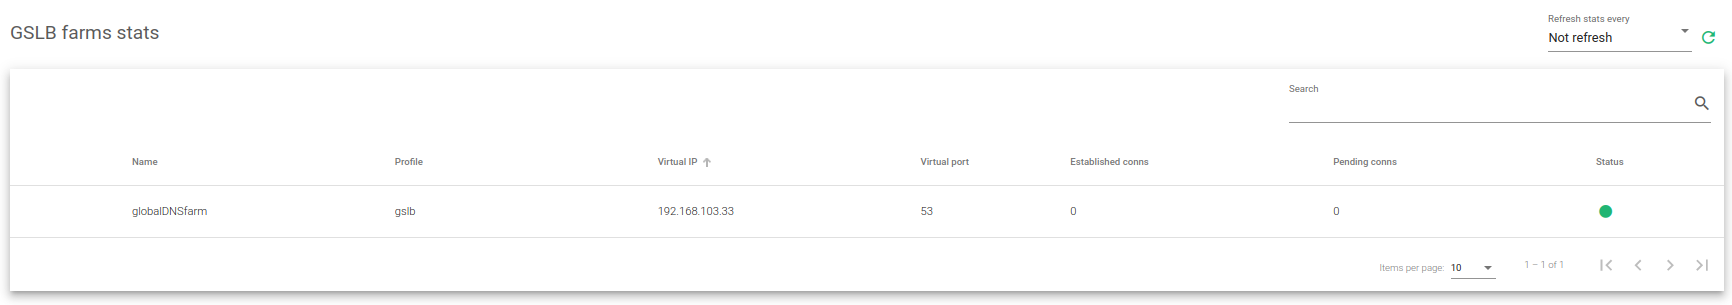
The stats table includes the following columns.
Name. Name of a farm or a virtual server.
Profile. Indicate that the profile is about a GSLB farm.
Virtual IP. IP address used by a virtual server to handle requests.
Virtual Port. Ports used by a virtual server to manage requests.
Established Conns. Connections marked as ESTABLISHED and traffic already processed.
Pending Conns. Connections marked as SYN. An increasing value means a higher rate of requests received can’t be served.
Status. These are the status indicators for request availability to the farm.
- Green. Means UP status. The farm is running and all backends are UP.
- Red. Means DOWN status. The farm is stopped and not managing traffic.
- Yellow. Means RESTART NEEDED. There are recent changes that need a farm restart to be applied.
- Black. Means CRITICAL. The farm is UP but there is no backend available or they are in maintenance mode.
- Blue. Means PROBLEM. The farm is running but at least one backend is down.
- Orange. Means MAINTENANCE. The farm is running but at least one backend is in maintenance mode.
By default, the stats show static data for the connections of each GSLB farm. However, you may set an auto-refresh after every 10, 30, 60, or 120 seconds.
Next step, see the GSLB farms graphs.