GSLB Farm Stats Graphs
This section shows the monitoring graphs and history of both established and pending connections of the active farm in four different time frames, i.e. last day, last week, last month and last year.
Here is an overview of the connections.
Established. These are confirmed connections marked as ESTABLISHED. For GSLB farms, this means the DNS requests are receiving responses from the the backends.
Pending. These are connections to the GSLB farm that have not received a response yet from the backends. An increased rate means more requests have not been served.
Each graph also indicates the last value gathered, minimum, maximum and average values.
For more details, refer to the images below.
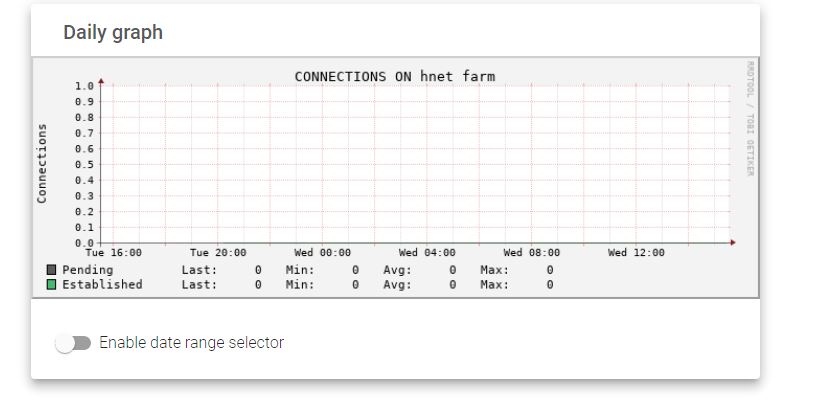
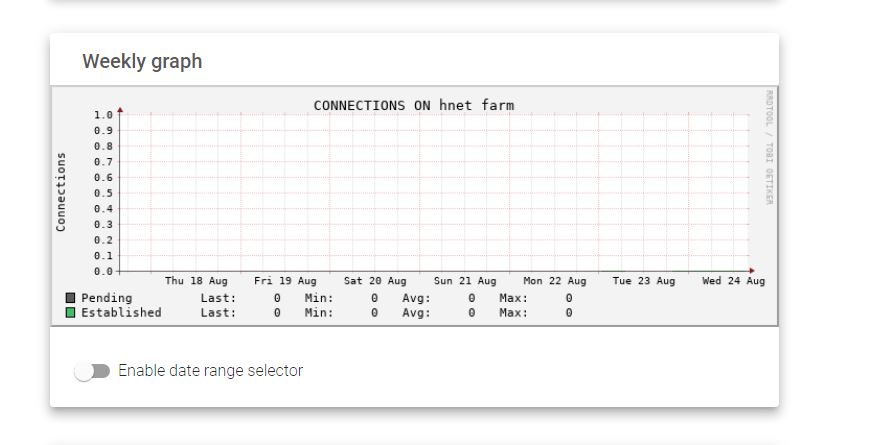
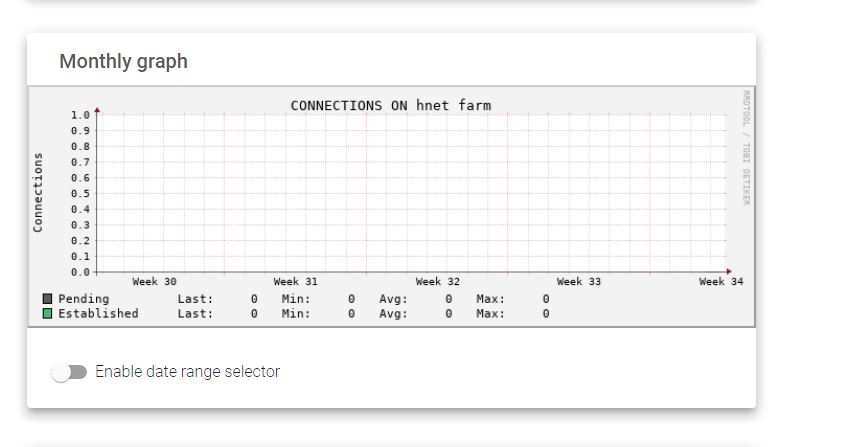
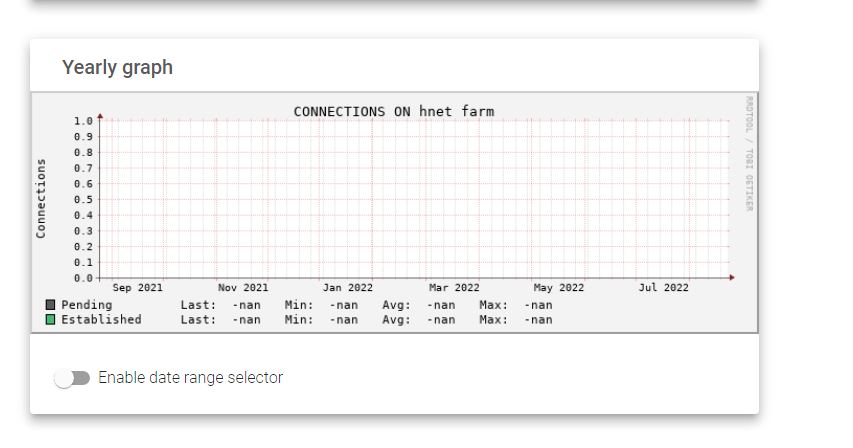
Note You may select a range of statistical data by toggling the Enable data range selector button.
Next step, see the GSLB backends stats.