Contents
Monitoring System Stats
This section shows statistics about the most crucial resources available in the load balancer. It also presents graphs and stats about the Memory, CPU, and the Load.

To toggle between the three states, use the drop-down option at the top right.
Monitoring System Memory
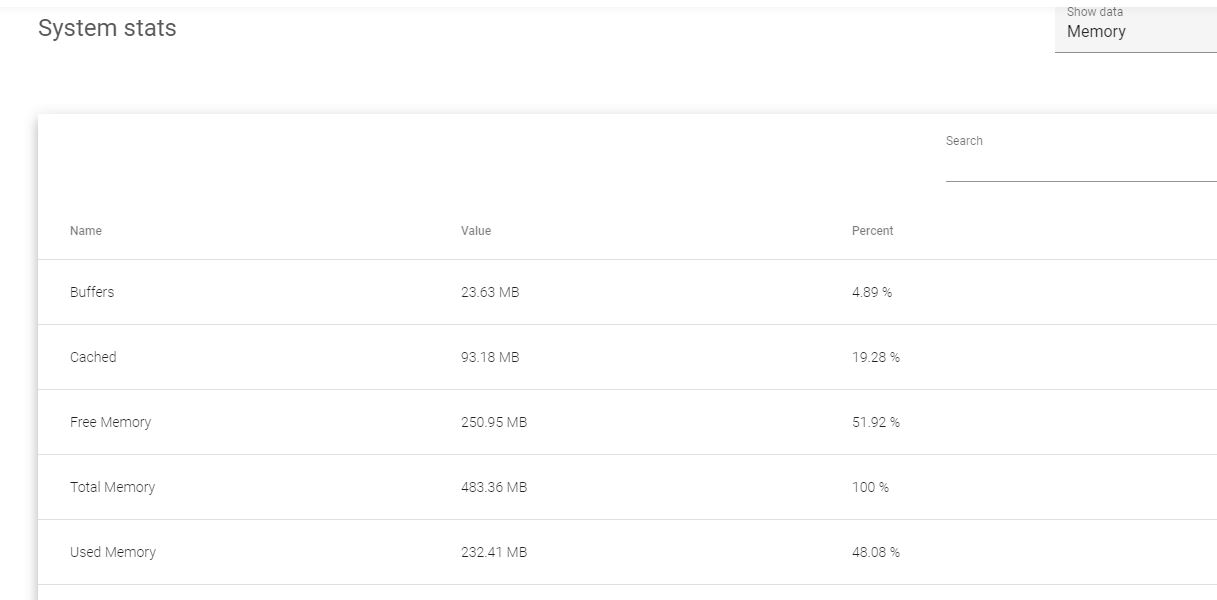
These are the resources that define the system’s memory.
Buffers. Temporary memory units that are used to balance processing speeds between 2 or more processes.
Cached. The volatile memory which is allocated to the CPU.
Free Memory. The memory that has not been used by the load balancer.
Total Memory. All the memory that is available for use by the load balancer.
Used Memory. Memory that has been used by the load balancer.
Cached Swap. It’s the total cache memory reserved.
Free Swap. Swap memory that has not been used by the load balancer.
Total Swap. Total memory from the HDD or SSD that is used as RAM.
Used Swap. The amount of swap memory that has been used.
Monitoring System CPU
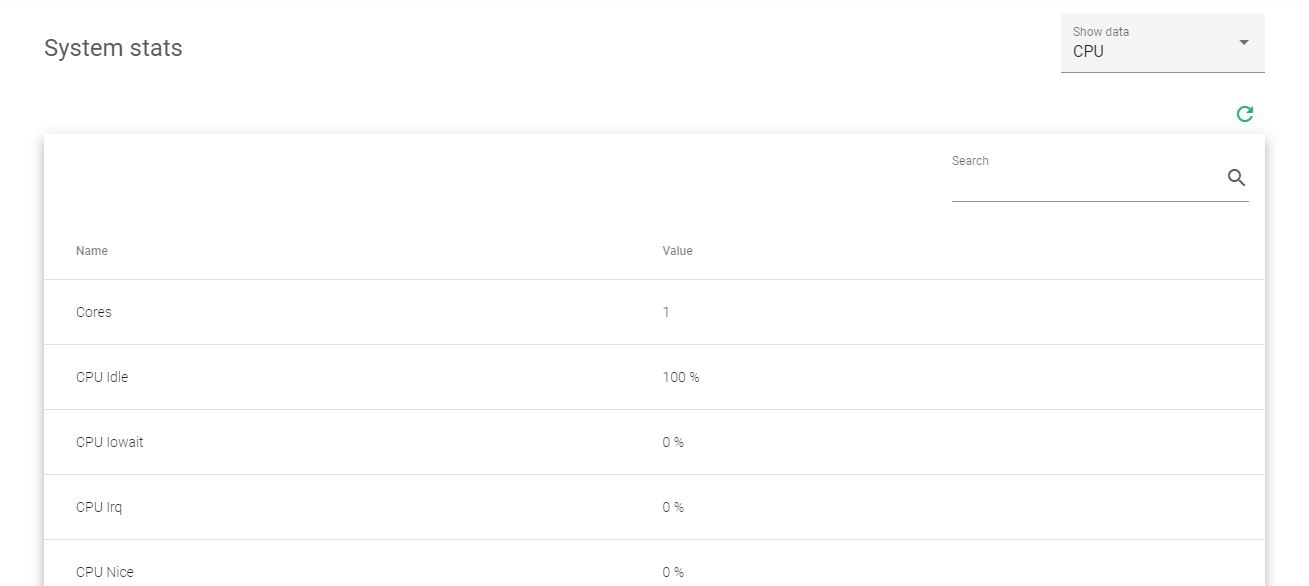
These are the resources that define the system’s CPU.
Cores. The number of cores allocated to the load balancer’s processor.
CPU Idle. The %age of processing resources that are not being used.
CPU Iowait. Usage of I/O tasks like the disk or networking.
CPU Irq. Usage of interrupts to the main CPU.
CPU Nice. Usage of prioritized processes in the system.
CPU Softirq. Usage of serving software interrupts.
CPU Sys. Usage of kernel space processes. Example: L4 farms, network drivers, etc.
CPU Usage. % of processing resources that are being used.
CPU User. % used that is being used by normal processes in userspace. Example: HTTP/S load balancer cores, administration web server, etc.
Monitoring System Load
The figure below shows the load count within the first 1, 5, and 15 minutes.
