POSTED ON 12 March, 2020
This section shows a table including the number of established and pending connections found for every GSLB farm. The number of connections shown is about the current stats in a certain instant.
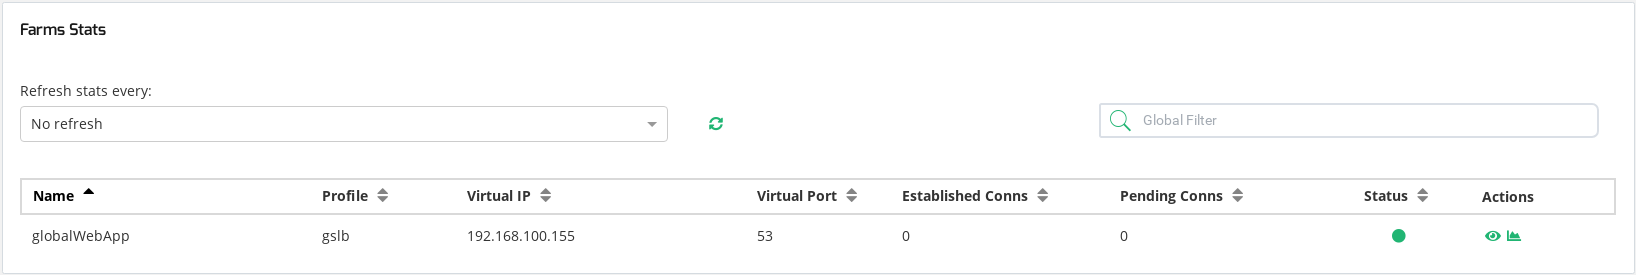
This table includes the following columns:
- Name. Descriptive name of the farm.
- Virtual IP. IP address used by the virtual service to handle requests.
- Virtual Port. Ports used by the virtual service to wait for requests.
- Established Conns. Connections marked as ESTABLISHED. For L4xNAT profile farms this means connected to a backend. For HTTP profiled farms this means connected to the virtual server.
- Pending Conns. Connections marked as SYN. An increasing value means a higher rate of requests received that can’t be served.
- Status. This shows the state of the farm with the following possibilities:
- Green: Means UP. The farm is running and all backends are UP.
- Red: Means DOWN. The farm is stoped.
- Yellow: Means RESTART NEEDED. There are recent changes that need a farm restart to be applied.
- Black: Means CRITICAL. The farm is UP but there is no backend available or they are in maintenance mode
- Blue: Means PROBLEM. The farm is running but at least one backend is down.
- ACTIONS. This column has two icons for every farm, an icon Show graphs to expand the graphs view and an icon Show backends stats to expand the backends view.
By default, the statistics will show a single sample of the connections found for GSLB farms, but it is also possible to refresh the data every 10, 30, 60 and 120 seconds.
Next step, see the farms graphs.
Documentation under the terms of the GNU Free Documentation License.