This section joins all the System, Network Interfaces and Farms Services monitoring graphs. Useful in order to have a detailed report and history monitoring information to know which resources is dedicating the load balancer for every kind of task and easily detect any resource limiting or bottlenecks in your load balancer and services.
You can change among the distinct graphs through the tabs idenfied with the same name:
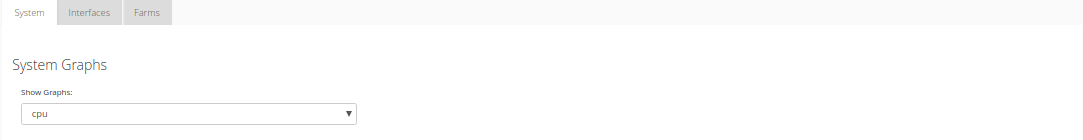
System Graphs. Includes the graphs of the most important the system resources.
Free. % without usage.
User. % used that is being used by normal processes in user space. Example: HTTP/S load balancer cores, administration web server, etc.
Nice. Usage of prioritized processes in the system.
System. Usage of kernel space processes. Example: L4 farms, network drivers, etc.
Iowait. Usage of I/O tasks like disk or networking.
Irq. Usage of interrupts to the main CPU.
Softirq. Usage of servicing softirqs.
Load. Load monitoring information about the last minute, 5 minutes and 15 minutes, so we can discover the progression and trend of the system load.
RAM memory. Monitoring information about what kind of tasks the RAM memory has been dedicated to.
Free. Memory available in the system.
Used. Memory not available and used by the kernel and processes in the system.
Cached. Memory allocated but not currently used by any process.
Buffers. Memory used by buffers in the system.
Swap memory. Monitoring graphs and information about the usage of swap memory.
Disk partitions. Monitoring graphs and details about every disk partition defined in the system. The most important ones are:
/usr/local/…/config. Disk space where all the configuration files are being stored.
/var/log. Disk space where all the logs are being stored.
Interfaces Graphs. Monitoring graphs and details for every physical and VLAN interfaces created in the load balancer.
Farms Graphs. Monitoring graphs and details of the number of Established (already assured connections) or Pending (the connection has been initiated but not assured) for every farm or load balancing service created in the load balancer.
Every graph page includes daily, weekly, monthly and yearly graphs, and the data is collected every 5 minutes.