Contents
This section shows the current whole status of a Zevenet load balancer appliance: CPU usage, memory, load, connections, system information, farms status, interfaces configured, status and consumption. The dashboard has three sections: system, farms and network interfaces.
System Status
The top side of the Dashboard will show in graphics the current resources usage.
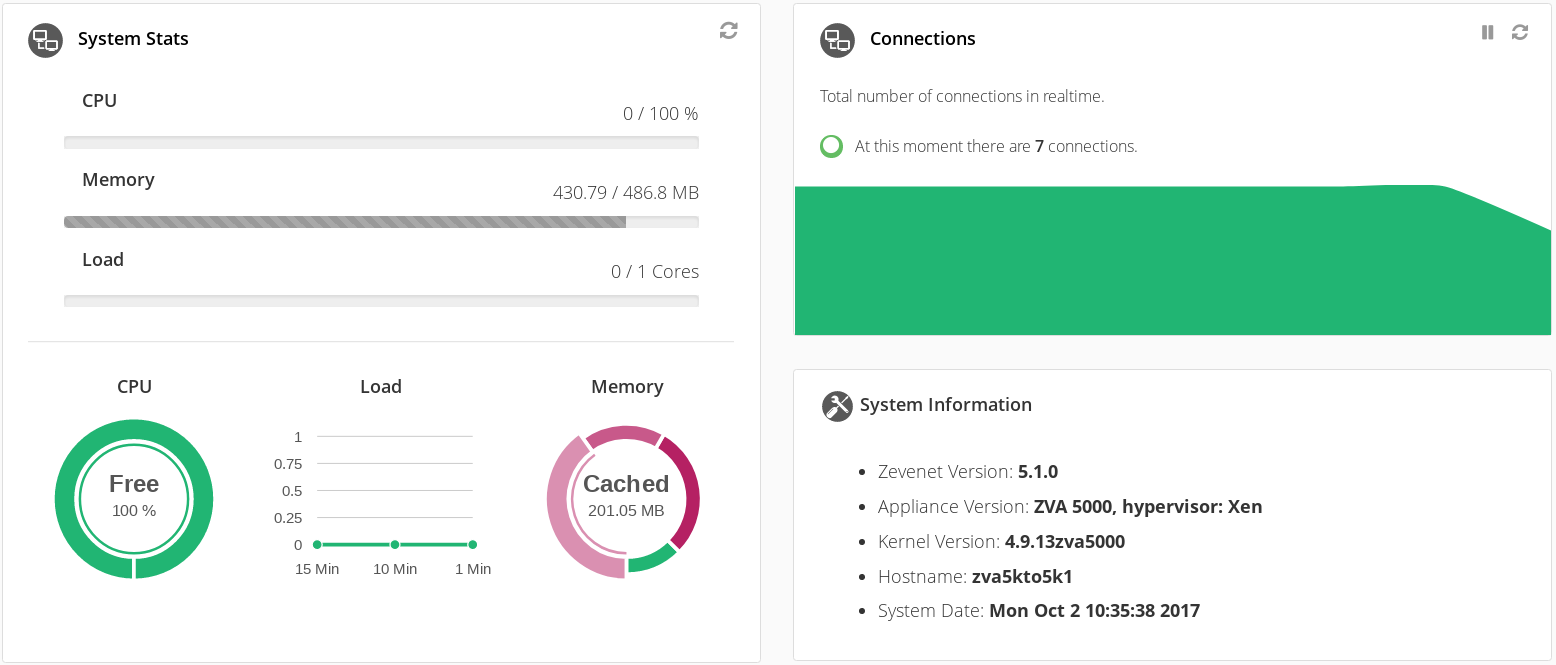
In order to refresh the graphs, click on the refresh button on the top right of the graph.
CPU Usage
Measurements in the percentage of CPU available in the system.
Free. CPU not being used.
User. Usage of normal processes in userspace. Example: HTTP/S load balancer cores, administration web server, etc.
Nice. Usage of prioritized processes in the system.
System. Usage of kernel space processes. Example: L4 farms, network drivers, etc.
Iowait. Usage of Input/Output tasks like disk or networking.
Irq. Usage of interrupts to the main CPU.
Softirq. Usage of serving software interrupts.
Memory Usage
Free. Memory available in the system.
Used. Memory not available and used by the kernel and processes in the system.
Cached. Memory allocated but not currently used by any process.
Buffers. Memory used by buffers in the system.
Load Usage
Indicates the number of cores loaded and the history and progression of the load in the whole appliance during the last minute, last 5 minutes and last 15 minutes.
Connections Graph
Real-time connections graph that is supporting the whole appliance. In the top right of the graph, it’s available a pause and refresh button.
System Information
Basic information related to the appliance: Zevenet Version, Appliance version and hypervisor, kernel version, hostname, and system date.
Farms Info
For every type of Load Balancing Service summarizes the number of total, available or down farms services.

Zevenet is able to work at different layers and with very different methods, the farms profiles available are:
LSLB (Local Service Load Balancing). This kind of farm is able to serve virtual services and applications at layer 4 (through L4xNAT profile) and at layer 7 (through HTTP profile). The incoming connections will be managed and shared to the backends via a big list of protocols available: TCP/UDP/SCTP/HTTP/HTTPS. More info
DSLB (Datalink Service Load Balancing). This kind of farm allows to load balance uplinks through layer 3 using dynamic load balancing routing. More info
GSLB (Global Service Load Balancing). This kind of farm allows to load balance domains and data centers using a DNS service load balancing technology. More info
For each of the farms profiles the widget shows how many farms there are in total and how many of them are in the differents possible status:
Up. The farm is running normally
Problem. When the farm is up but at least one of the backends is not reachable or presents a problem.
Critical. When the farm is up but none of the backends are reachable. They can be down or in maintenance mode.
Down. The farm is totally stopped
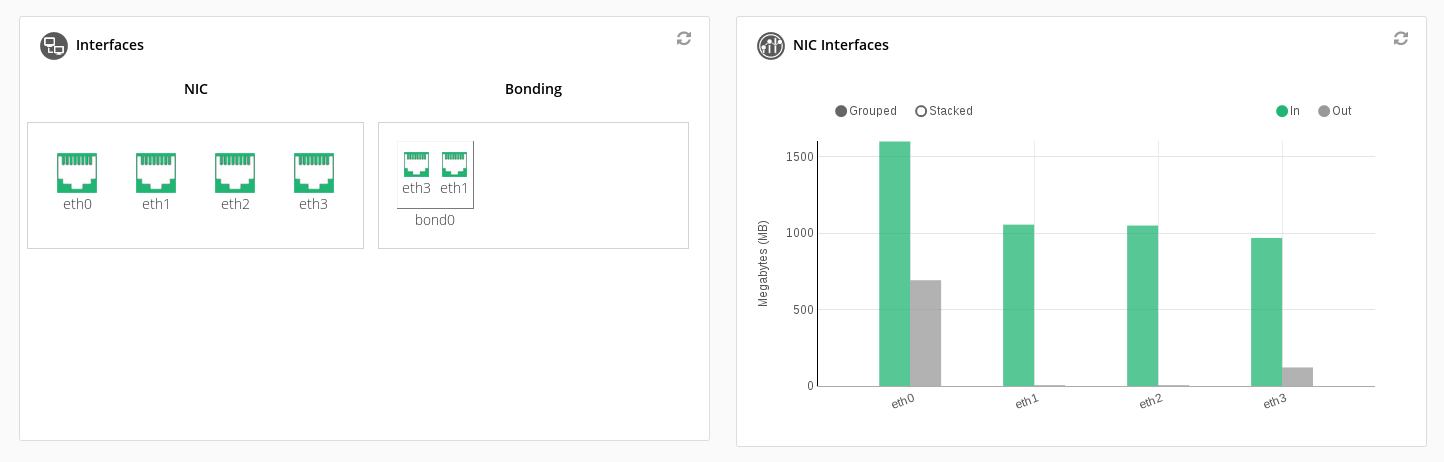
NIC Interfaces
Graphic representation of every network interface (physical and bonding) and the naming of every one. When the cursor is over a certain interface, a summarize with the inbound and outbound traffic and virtual/VLANs interfaces for every interface will be shown.
Next step, manage farms.