MONITORING::GRAPHS SECTION
This section is useful to monitorize the internal load balancer system to detect problems through the parameters of CPU usage, swap memory, ram memory, all configured nework interfaces, load and hard disk storage.
All the graphs that are shown in the first page are the daily progress value of every parameter. Also, you’ll be able to access to the weekly, mothly and yearly history through the ![]()
![]() button.
button.
MONITORING::LOGS SECTION
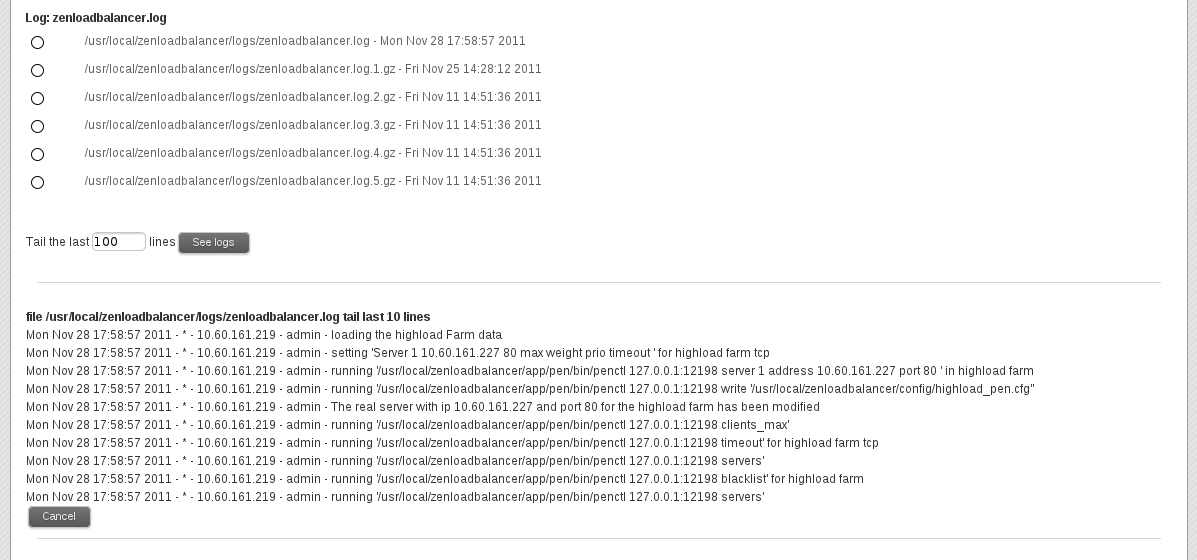
This section is used to access to the system logs. To display the logs you’ve to select one of the log files and then establish the number of tailed lines to be shown pressing the See logs button.
ucarp.log. Log file for cluster service.
zenlatency.log. Log file for latency service launcher of ucarp service.
zeninotify.log. Log file for config replication service.
mini_https.log. Log file for the web gui http service.
zenloadbalancer.log. Log file for the global zen load balancer actions service through the web GUI.
farmguardian.log. Log file for farmguardian advanced monitoring service.