Contents
Overview
The goal of this article is explaining how to monitor Zevenet’s system health and performance with Zabbix monitoring system. Zabbix is a popular enterprise open source network and application monitoring software created by Alexei Vladishev.
In this document we will use Zabbix Linux Agent to get metrics from Zevenet ADC Load Balancer appliance. We have chosen this method because is the easiest way to monitor the system health and performance of a Zevenet ADC Load Balancer appliance. In further howto’s, we will explain how to setup SNMP daemon to implement SNMP monitoring and how to use ZAPI for getting custom metrics from your Zevenet appliance.
Explaining Zabbix Server installation and setup is out of the scope of this document. You can refer to Zabbix official documentation https://www.zabbix.com/documentation/3.0/manual/installation in case you need help installing and configuring Zabbix Server.
For our tests we will use Zabbix Server 3.0.9:
root@monitor:~# zabbix_server -V | grep zabbix_server
zabbix_server (Zabbix) 3.0.9
And Zevenet 5.0.8:
root@zvato505:~# dpkg -l zevenet | grep zevenet
ii  zevenet        5.0.8        amd64        ZEVENET Load Balancer Enterprise Edition
With Zabbix Agent 3.0.9:
root@zvato505:~# zabbix_agentd -V | grep zabbix_agentd
zabbix_agentd (daemon) (Zabbix) 3.0.9
Conventions
We will use the following conventions in this document:
| Name | Value |
| Zabbix Server IP address | 192.168.0.187 |
| Zabbix Server port | 10050 |
| Zabbix Server Web Interface URL | http://192.168.0.187 |
| Zevenet ADC Load Balancer appliance IP address | 192.168.100.10 |
Installing Zabbix Agent in Zevenet ADC Load Balancer
To install Zabbix agent you must login as root into Zevenet ADC Load Balancer console:
1. Execute the following command to download latest Zabbix agent from official repository:
wget http://repo.zabbix.com/zabbix/3.0/debian/pool/main/z/zabbix/zabbix-agent_3.0.9-1+jessie_amd64.deb
Example output:
root@monitor:~# wget http://repo.zabbix.com/zabbix/3.0/debian/pool/main/z/zabbix/zabbix-agent_3.0.9-1+jessie_amd64.deb
--2017-06-05 11:13:16--  http://repo.zabbix.com/zabbix/3.0/debian/pool/main/z/zabbix/zabbix-agent_3.0.9-1+jessie_amd64.deb
Resolving repo.zabbix.com (repo.zabbix.com)... 162.243.159.138
Connecting to repo.zabbix.com (repo.zabbix.com)|162.243.159.138|:80... connected.
HTTP request sent, awaiting response... 200 OK
Length: 342848 (335K) [application/x-debian-package]
Saving to: ‘zabbix-agent_3.0.9-1+jessie_amd64.deb’

zabbix-agent_3.0.9-1+jessie_amd64.deb                       100%[==========================================================================================================================================>] 334.81K   404KB/s   in 0.8s

2017-06-05 11:13:17 (404 KB/s) - ‘zabbix-agent_3.0.9-1+jessie_amd64.deb’ saved [342848/342848]
2. Install Zabbix agent package:
dpkg -i zabbix-agent_3.0.9-1+jessie_amd64.deb
Example output:
root@zvato505:~# dpkg -i zabbix-agent_3.0.9-1+jessie_amd64.deb
Selecting previously unselected package zabbix-agent.
(Reading database ... 50607 files and directories currently installed.)
Preparing to unpack zabbix-agent_3.0.9-1+jessie_amd64.deb ...
Unpacking zabbix-agent (1:3.0.9-1+jessie) ...
Setting up zabbix-agent (1:3.0.9-1+jessie) ...
Processing triggers for systemd (215-17+deb8u1) ...
Processing triggers for man-db (2.7.0.2-5) ...
Configuring Zabbix Agent in Zevenet ADC Load Balancer
1. Edit /etc/zabbix/zabbix_agentd.conf file and modify the following directives:
A. Put the IP address of your Zabbix server in Server directive:
### Option: Server
#       List of comma delimited IP addresses (or hostnames) of Zabbix servers.
#       Incoming connections will be accepted only from the hosts listed here.
#       If IPv6 support is enabled then '127.0.0.1', '::127.0.0.1', '::ffff:127.0.0.1' are treated equally.
#
# Mandatory: no
# Default:
# Server=

Server=
B. Put the IP address and port of your Zabbix server in ServerActive directive:
##### Active checks related

### Option: ServerActive
#       List of comma delimited IP:port (or hostname:port) pairs of Zabbix servers for active checks.
#       If port is not specified, default port is used.
#       IPv6 addresses must be enclosed in square brackets if port for that host is specified.
#       If port is not specified, square brackets for IPv6 addresses are optional.
#       If this parameter is not specified, active checks are disabled.
#       Example: ServerActive=127.0.0.1:20051,zabbix.domain,[::1]:30051,::1,[12fc::1]
#
# Mandatory: no
# Default:
# ServerActive=

ServerActive=:
C. Put the Zevenet hostname in Hostname directive:
### Option: Hostname
#       Unique, case sensitive hostname.
#       Required for active checks and must match hostname as configured on the server.
#       Value is acquired from HostnameItem if undefined.
#
# Mandatory: no
# Default:
# Hostname=

Hostname=
2. Start Zabbix agent:
service zabbix-agent start
3. Now we can test if agent is running with this command:
ps -ef | grep zabbix
Example output:
root@zvato505:~# ps -ef | grep zabbix
zabbix   30382     1  0 11:13 ?        00:00:00 /usr/sbin/zabbix_agentd -c /etc/zabbix/zabbix_agentd.conf
zabbix   30383 30382  0 11:13 ?        00:00:00 /usr/sbin/zabbix_agentd: collector [idle 1 sec]
zabbix   30384 30382  0 11:13 ?        00:00:00 /usr/sbin/zabbix_agentd: listener #1 [waiting for connection]
zabbix   30385 30382  0 11:13 ?        00:00:00 /usr/sbin/zabbix_agentd: listener #2 [waiting for connection]
zabbix   30386 30382  0 11:13 ?        00:00:00 /usr/sbin/zabbix_agentd: listener #3 [waiting for connection]
zabbix   30387 30382  0 11:13 ?        00:00:00 /usr/sbin/zabbix_agentd: active checks #1 [idle 1 sec]
root     30614 30257  0 11:13 pts/1    00:00:00 grep zabbix
4. Link Zabbix agent to correct runlevels, making sure Zabbix agent will start automatically in case of a system reboot.
update-rc.d zabbix-agent enable
Configuring Zabbix Server to monitor Zevenet ADC Load Balancer
At this point, we are ready to access Zabbix Server web administration interface, adding Zevenet ADC Load Balancer to Zabbix host database therefore Zabbix can start to monitor it.

- Access to Zabbix Server web administration interface.
- Go to Configuration > Hosts > Create Host.
- Fill in Host tab:
- Host name (Mandatory): Type Zevenet ADC Load Balancer appliance FQDN hostname or IP address.
- Visible name (Mandatory): Type Zevenet ADC Load Balancer appliance visible name.
- Add to a Hostgroup (Mandatory): i.e Load Balancers
- Agent Interfaces: (Mandatory): Type Zevenet ADC Load Balancer appliance FQDN hostname or IP address. Remember to set to “Connect to” to IP if you enter a IP address or DNS if you fill a FQDN hostname.
- Click in Templates tab and add template “Template OS Linux”.
- Click on Update button.
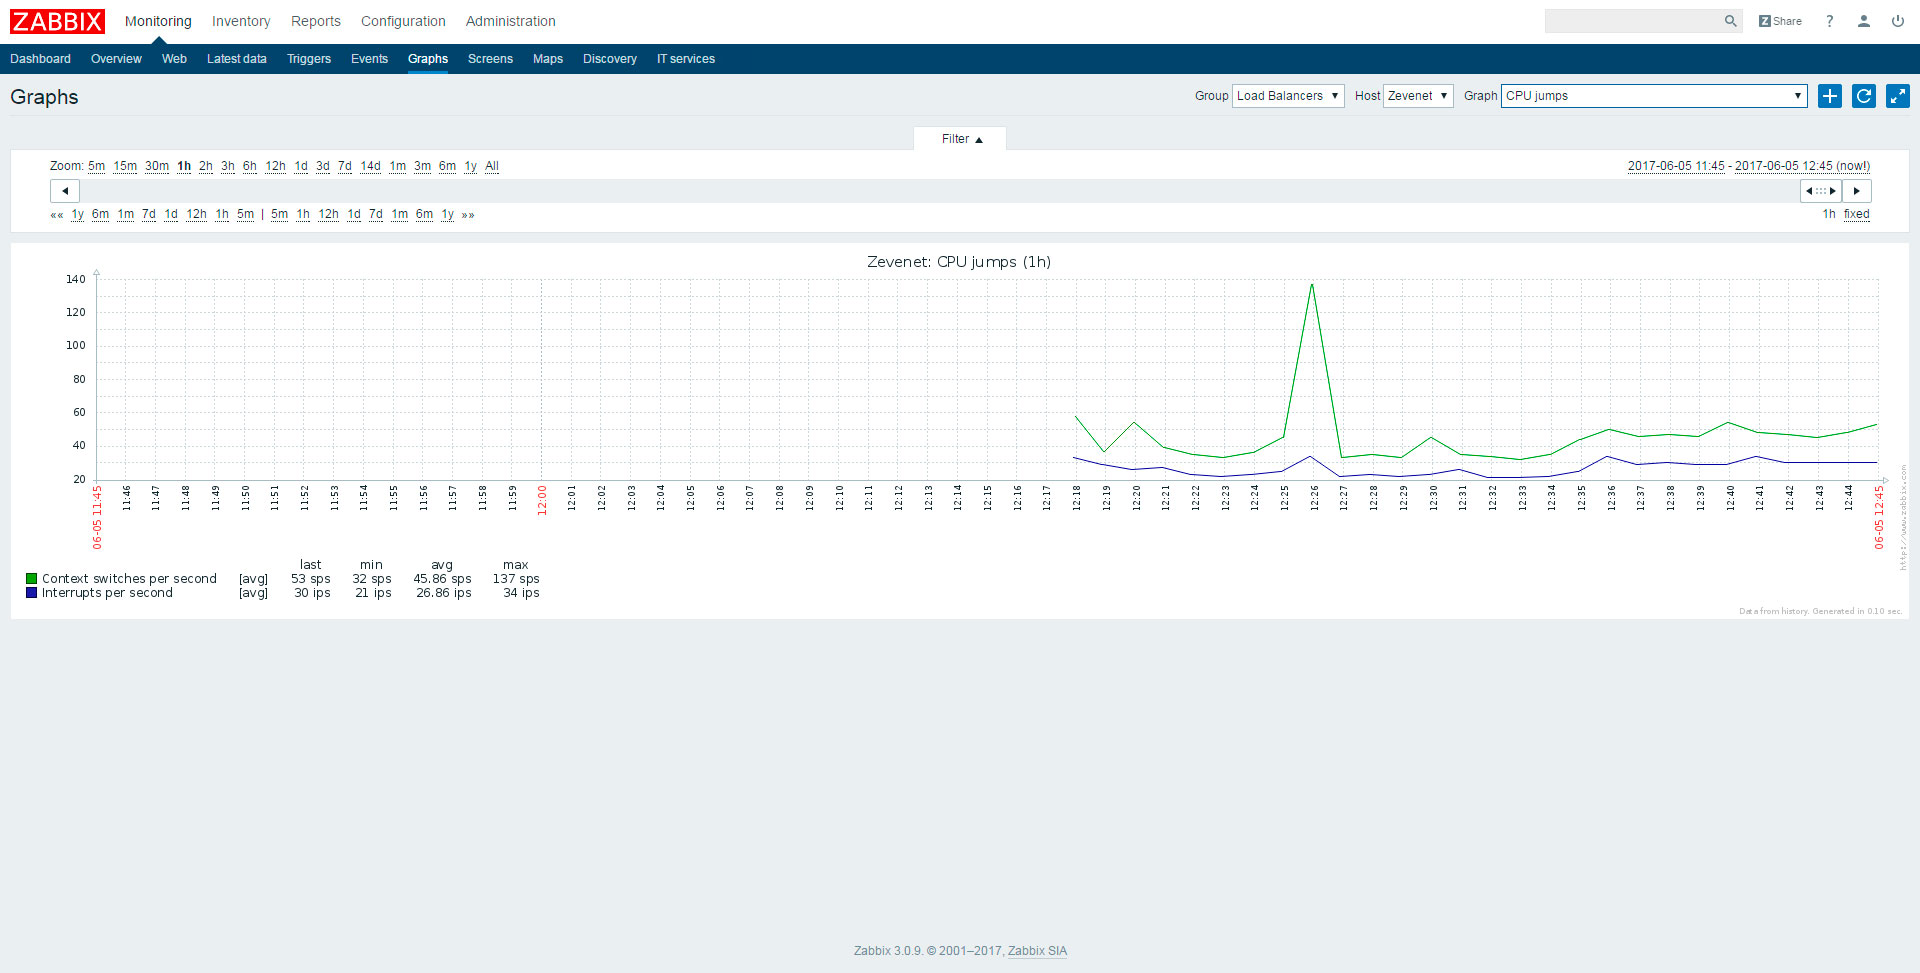
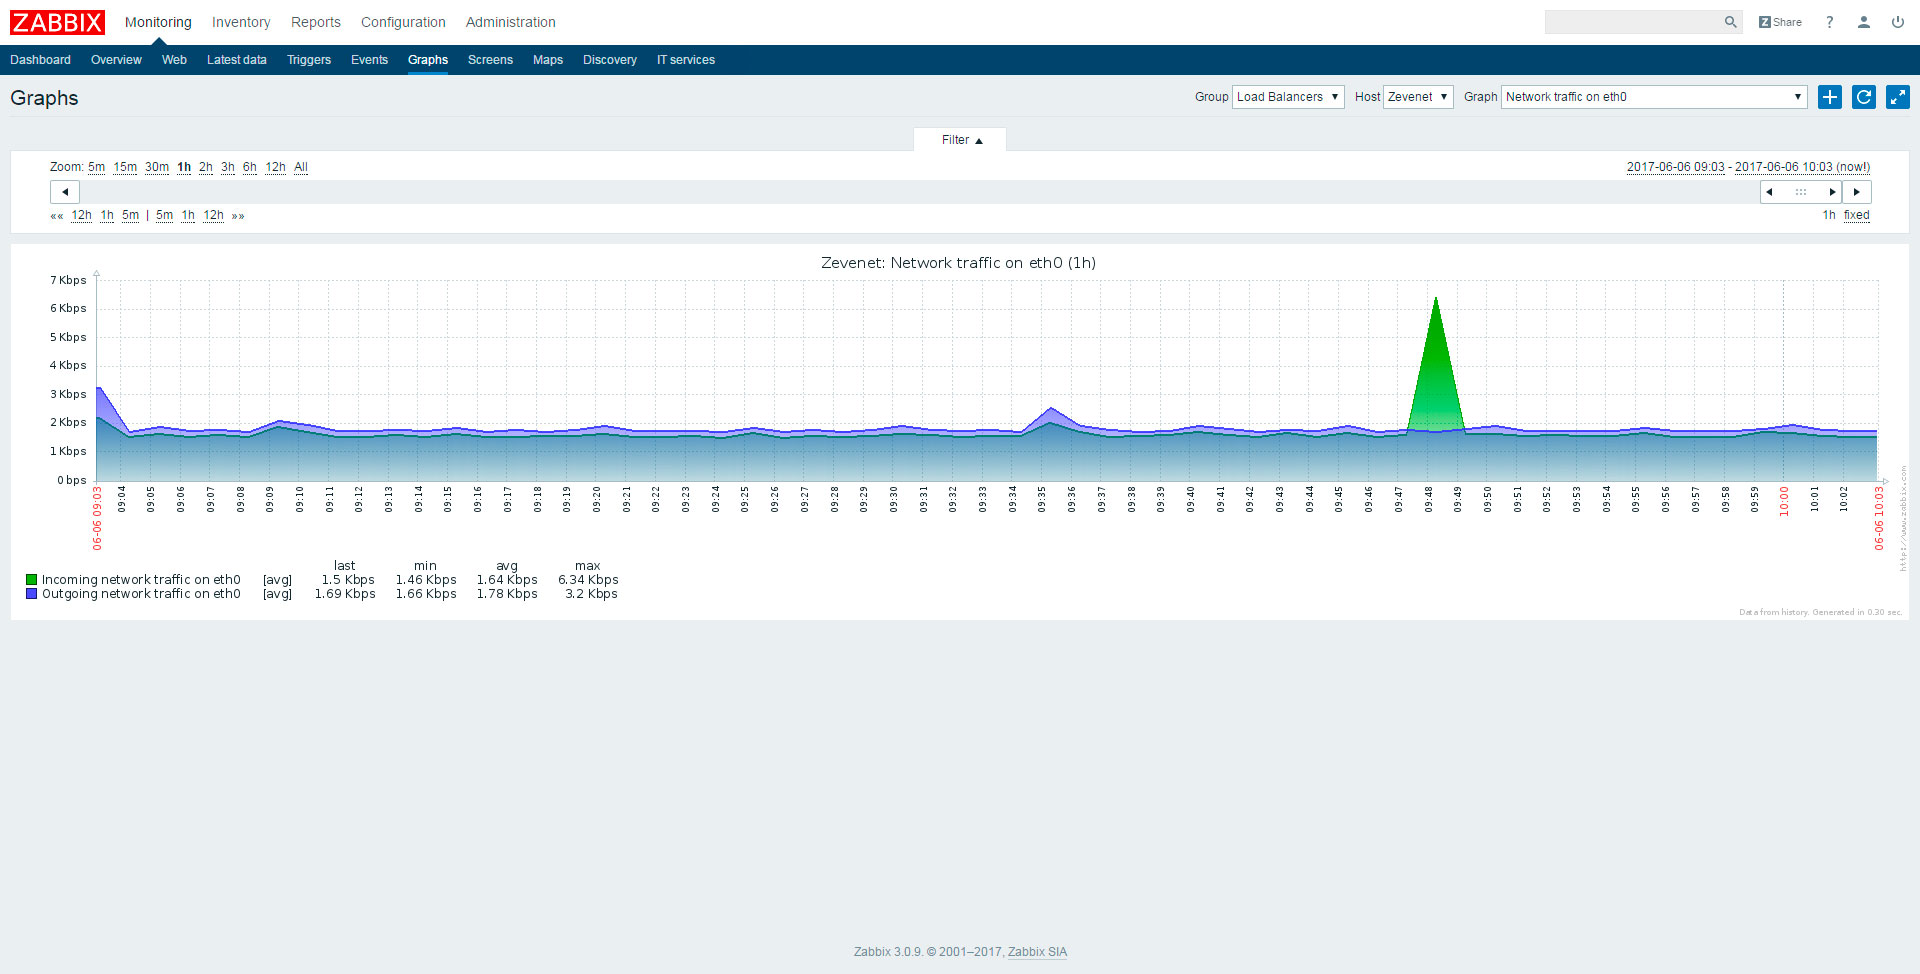
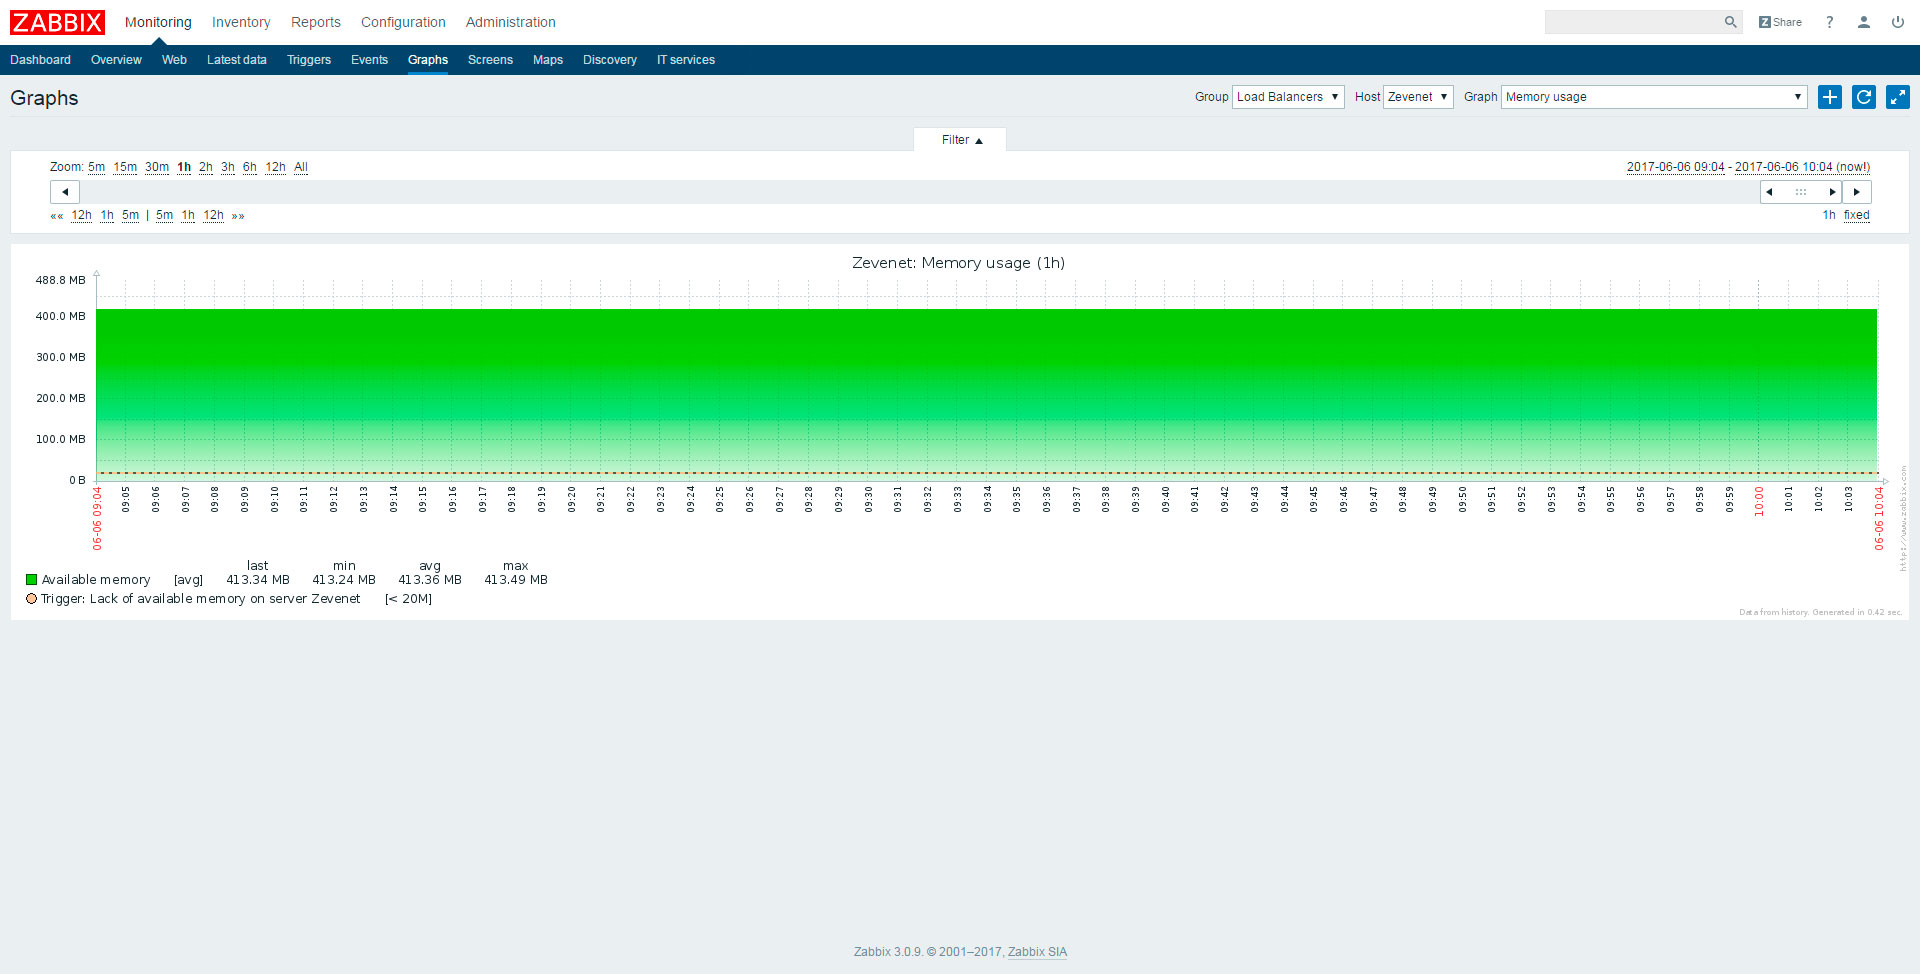
Performance graphs
That’s all! You can check all the metrics that Zabbix are able to get out of the box. Go to Monitoring > Graphs and select the graph type you want to see.
Create a custom trigger in Zabbix Server to monitor Zevenet appliance CPU usage
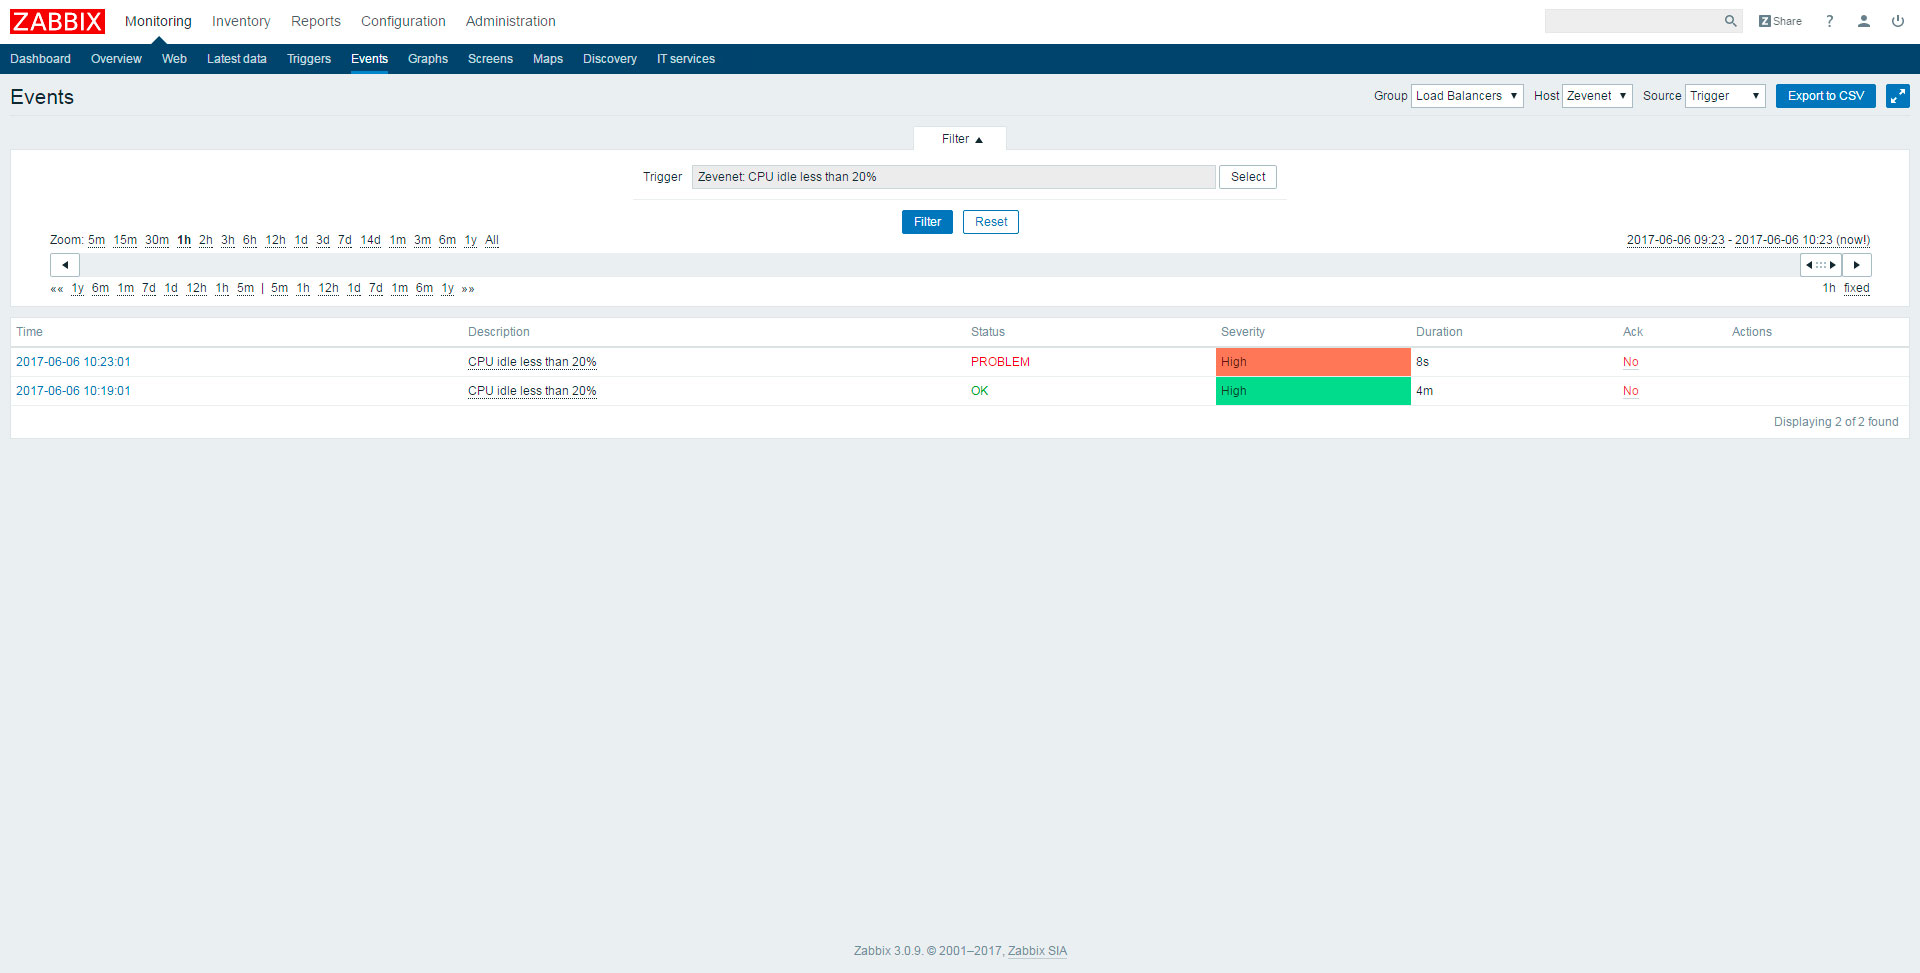
Now we have our Zevenet ADC Load Balancer monitored with a minimum effort, so now what? We are going to see how to create a custom trigger in Zabbix Server to monitor a specific behavior.
Let’s say that we need to monitor the CPU usage of a Zevenet appliance, and to be more specific let’s say that we want an alert in Zabbix Server if the CPU usage is higher that 20%.
1. Go to Configuration > Hosts, click on Zevenet host, click on Triggers and then click on button Create trigger.
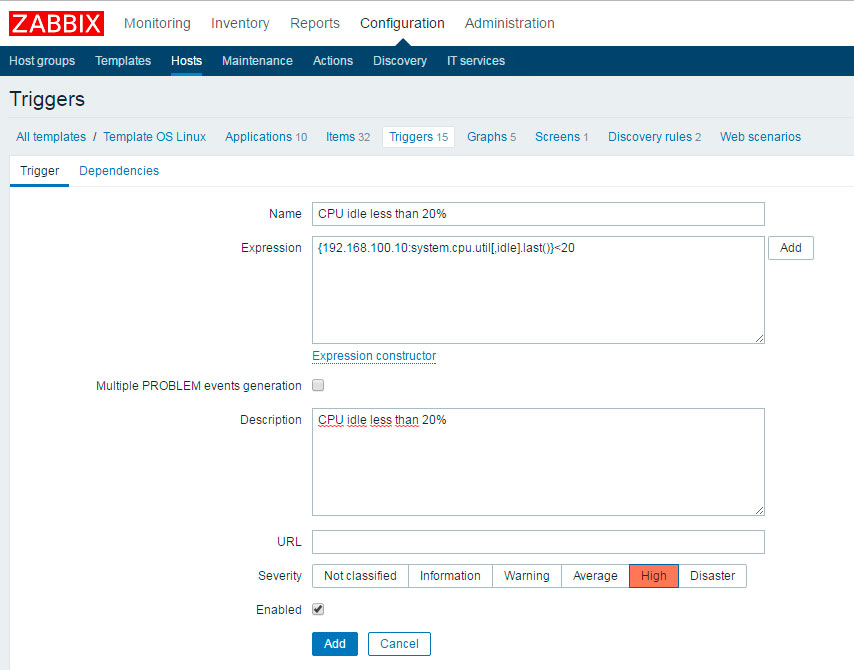
- Name: (Mandatory) Name of the trigger (i.e: CPU idle less than 20%)
- Expression: (Mandatory) {192.168.100.10:system.cpu.util[,idle].last()}<20 (Click on Add button to use a wizard to build the expression)
- Multiple PROBLEM events generation: (optional)
- Description: (optional)
- URL: (optional)
- Severity: (Mandatory) High
- Enabled: (Mandatory) Checked
2.Click on Add button.
To test the trigger we have just created login as superuser in Zevenet ADC Load Balancer and type this command:
IMPORTANT: DON’T TYPE THIS COMMAND IN A PRODUCTION LOAD BALANCER, TEST IT IN A DEVELOPMENT ENVIRONMENT. IT PRODUCES A 100% CPU USAGE!
for i in 1 2 3 4; do while : ; do : ; done & done
Go to Monitoring > Events and wait to see a ‘CPU idle less than 20%’ event triggered.