This section provides some global parameters for the load balancer server system.
The meaning of these parameters are the following:
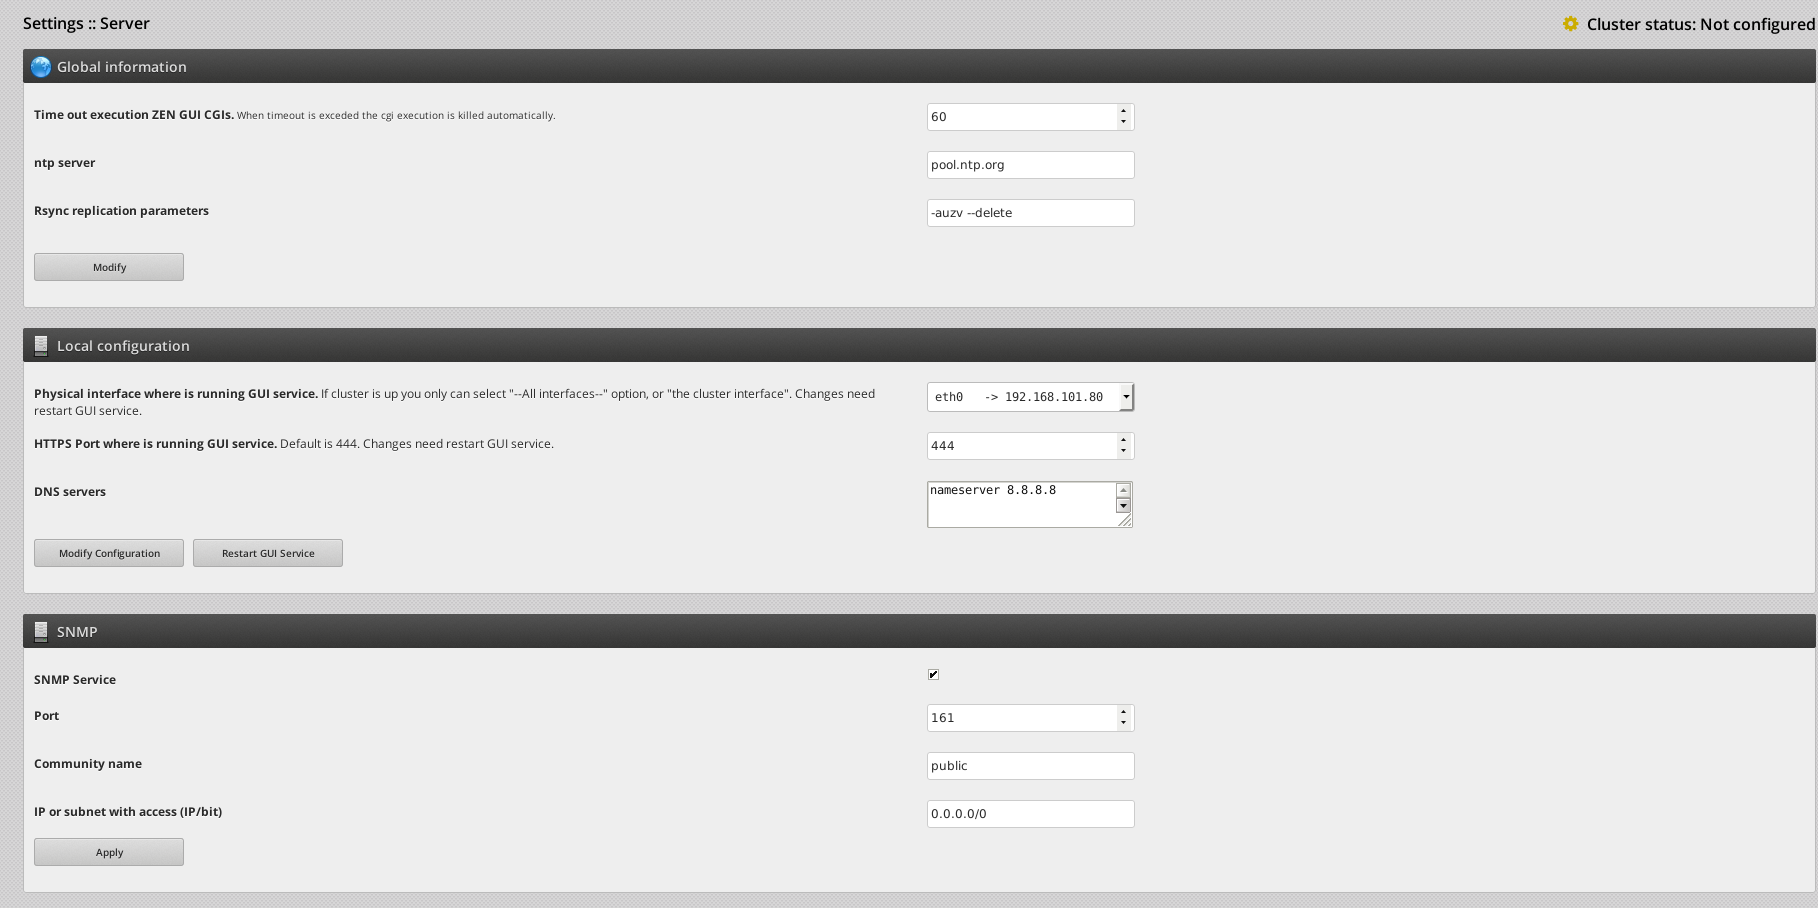
Time out execution Zen GUI CGIs. The Zen GUI web administration panel has been implemented in perl CGI, so this is the time limit to execute the cgi. If the page execution exceed this timeout, the process will be killed.
NTP server. Time server to syncronize the date-time of the system.
Rsync replication parameters. These are the parameters to syncronize the config data of the cluster replication. Do not change this settings if you dont know what are you doing.
Physical interface where is running the GUI service. This is the interface where the web panel service will be bind to. It’s safe to keep the All interfaces enabled. To apply the changes it’s needed to restart the GUI service.
DNS servers. This is the /etc/resolv.conf file content to apply the DNS servers for the system.
SNMP Service. Enable or Disable the SNMPD service in the system.
Port. UDP port used by SNMPD service, by default UDP 161.
DNS servers. This is the /etc/resolv.conf file content to apply the DNS servers for the system.
Community name. Read Only Community used.
IP or subnet with access (IP/bit). Allowed client IPs to acces SNMPD service, in case you want to allow access only one IP please use the bit “/32”.
Note: The SNMPD service is configured with a list of standard OIDs, the complete available list can be acceses with the following command:
snmpwalk -v2c 192.168.101.80 -c public .1
Hera some useful available OIDs if SNMPD is enabled.
Load
1 minute Load: .1.3.6.1.4.1.2021.10.1.3.1
5 minute Load: .1.3.6.1.4.1.2021.10.1.3.2
15 minute Load:
CPU
percentage of user CPU time: .1.3.6.1.4.1.2021.11.9.0
raw user cpu time: .1.3.6.1.4.1.2021.11.50.0
percentages of system CPU time: .1.3.6.1.4.1.2021.11.10.0
raw system cpu time: .1.3.6.1.4.1.2021.11.52.0
percentages of idle CPU time: .1.3.6.1.4.1.2021.11.11.0
raw idle cpu time:
raw nice cpu time:
Memory Statistics
Total Swap Size: .1.3.6.1.4.1.2021.4.3.0
Available Swap Space: .1.3.6.1.4.1.2021.4.4.0
Total RAM in machine: .1.3.6.1.4.1.2021.4.5.0
Total RAM used: .1.3.6.1.4.1.2021.4.6.0
Total RAM Free: .1.3.6.1.4.1.2021.4.11.0
Total RAM Shared: .1.3.6.1.4.1.2021.4.13.0
Total RAM Buffered: .1.3.6.1.4.1.2021.4.14.0
Total Cached Memory: .1.3.6.1.4.1.2021.4.15.0
Disk Statistics
Path where the disk is mounted: .1.3.6.1.4.1.2021.9.1.2.1
Path of the device for the partition: .1.3.6.1.4.1.2021.9.1.3.1
Total size of the disk/partion (kBytes): .1.3.6.1.4.1.2021.9.1.6.1
Available space on the disk: .1.3.6.1.4.1.2021.9.1.7.1
Used space on the disk: .1.3.6.1.4.1.2021.9.1.8.1
Percentage of space used on disk: .1.3.6.1.4.1.2021.9.1.9.1
Percentage of inodes used on disk: .1.3.6.1.4.1.2021.9.1.10.1
System Uptime: .1.3.6.1.2.1.1.3.0
There is more available information in OIDs but it has been not documented here, in case you are interested in obtain information related with Farms, please use the ZAPI for this purpose.