Contents
This section shows the current whole status of a Zevenet load balancer appliance: CPU usage, memory, load, system information, farms status, interfaces configured, status and consumption. The dashboard is distributed in: Professional Info, System stats and Farms report.
System Status
The top side of the Dashboard shows Profesional Services of the company, Products and News.
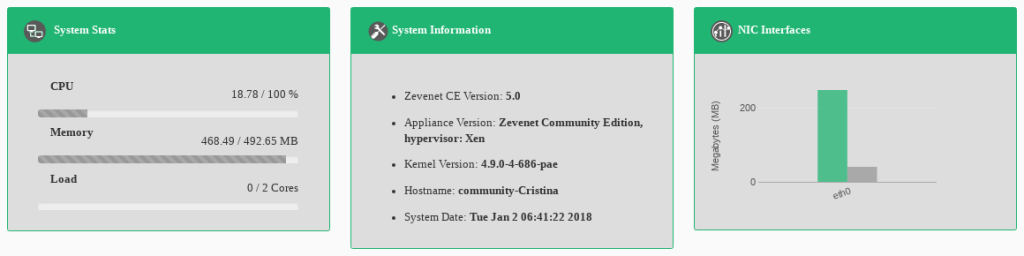
The next row shows System Stats, general System Information and NIC Interfaces traffic.
Among the information offered by the dashboard you could find the following sections:
CPU Usage
Free. % without usage.
Memory Usage
Free / Total. Memory available in the system.
Load Usage
Indicates the number of cores loaded and the history and progression of the load in the whole appliance during the last minute, last 5 minutes and last 15 minutes.
System Information
Basic information related with the appliance: Zevenet Version, Appliance version and hypervisor, kernel version, hostname and system date.
NIC Interfaces
Network Inbound traffic (green bar) and network Outbound traffic (gray bar) since the zevenet service was started.
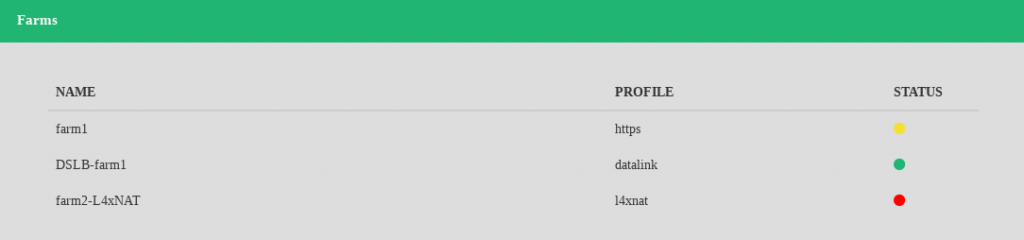
Farms Info
For every type of Load Balancing Service this section summarizes the number of total, available or down farms services.
As ZEVENET is able to work at different layers and with very different methods, the farms profiles available are:
LSLB (Local Service Load Balancing). This kind of farm is able to serve virtual services and applications at layer 4 (through L4xNAT profile) and at layer 7 (through HTTP profile). The incoming connections will be managed and shared to the backends via a big list of protocols available: TCP/UDP/SCTP/HTTP/HTTPS. More info
DSLB (Datalink Service Load Balancing). This kind of farm allows to load balance uplinks through layer 3 using dynamic load balancing routing. More info
For each of the farms profiles the widget shows the differents possible status:
Up. The farm is running normally
Problem. When the farm is up but at least one of the backends is not reachable or presents a problem.
Critical. When the farm is up but none of the backends are reachable. They can be down or in maintenance mode.
Down. The farm is totally stopped
Next step, manage farms.