This section provides information about farm stats.
Some parameters displayed:
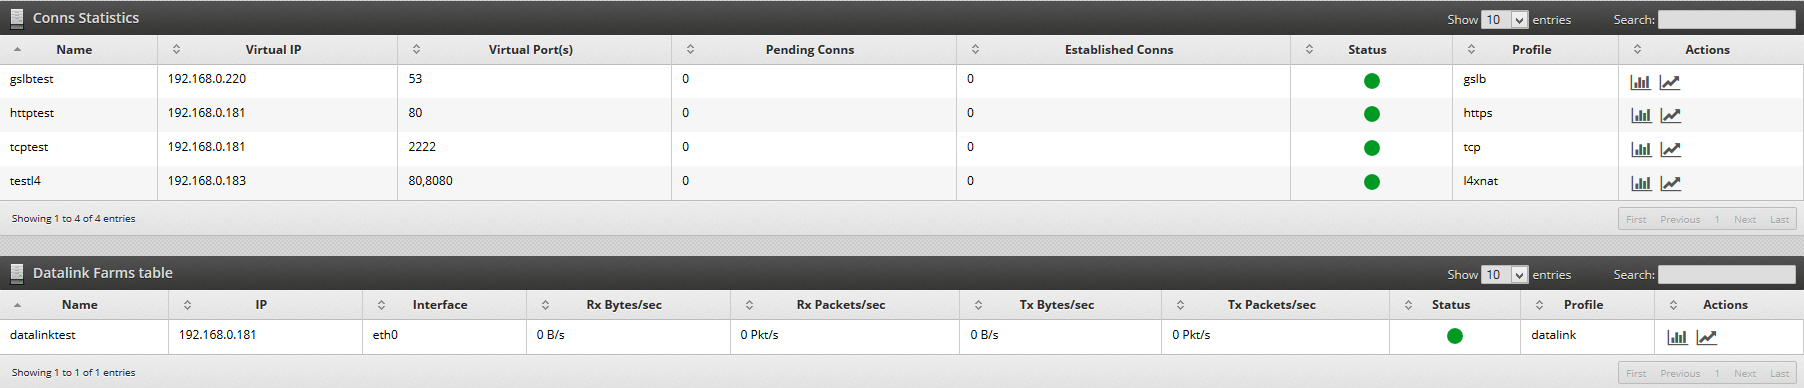
Pending Conns are calculated with the input SYN requests that are pending to be processed in the system for this farm.
Established Conns are calculated with the input ESTABLISHED requests that are processing currently.
Status field shows the state of the farm system process with a green dot if the farm is up or a red dot if the farm is down.
Profile field shows the profile definition selected at the creation time for the current farm.
Actions field shows the available options for every farm, which could be:

 Show connection graphs: Daily, weekly, monthly and yearly connections graphs will be displayed if this button is clicked.
 Show global status: This action shows the current state of backends, clients and connections that are being delivered from the virtual service to the real servers.
SHOW GLOBAL STATUS
This action shows the current state of backends, clients and connections that are being delivered from the virtual service to the real servers.

Service. It’s the service name associated to the current backend. This is only available for HTTP farm profiles.
Server. It’s the backend identification number within the service if defined.
Address. It’s the real server IP address.
Port. It’s the port number where the real service of the current real server is listening on.
Status. A red dot means that the current real server is down or blacklisted (it could be due to a connection error or due to farmguardian advanced checking), meanwhile a green dot means that the backend is online and delivering connections. A yellow dot means that the backend is in maintenance mode.
Pending Conns. This is the number of pending connections in the system that are on SYN state for the current backend, indepently of farm service.
Established Conns. This is the number of established connections in the system that are on ESTABLISHED state for the current backend, indepently of farm service.
Depending the Farm profile this section could show an additional table with information related to the kind of profile, for example, for HTTP profiles this section shows an additional table with information related to persistence, for GSLB profiles this section shows information related to DNS requests.
Note that for very high load farms showing this table could slowdown the machine and could be shown a very large table.

Additionally, the datalink farm profiles provides the specific status parameters that are listed below.
Interface. It’s the load balancer network interface connected to the backend.
Rx Total Bytes. Total bytes received for the current backend.
Rx Bytes/sec. Bytes received per seconds for the current backend.
Rx Total Packets. Number of the total received packets.
Rx Packets/sec. Number of the total received packets per second.
Tx Total Bytes. Number of total bytes transmitted.
Tx Bytes/sec. Number of total bytes per second transmitted.
Tx Total Packets. Number of total packets transmitted.
Tx Packets/sec. Number of total packets per second transmitted.