The Global View section is used to know the actual instant state of the system, like a photo system status.
Under this section you’ll be able to analyze the farms state, memory, cpu consumption, established connections and the % of established connections from the total system connections consumed by every farm.
The Global Farms Information table summarizes the farm status you’ll be able to control the farms status with a simple view, which of them are on UP status, how many resources are using and which of them are on DOWN status.
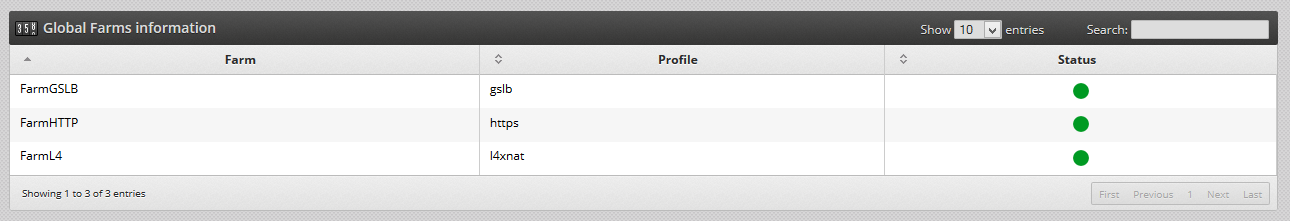
In this table you can analyze the name, profile and status of the farms.
The Memory table shows the global memory status measured in Megabytes.
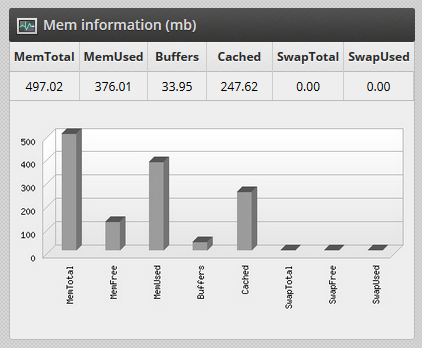
MemTotal: It’s the total ram memory on the system.
MemFree: It’s the total free memory not cached by the system.
MemUsed: It’s the memory used by the system.
Buffers: It’s the memory used by the buffers.
Cached: It’s the total memory cached by the system.
SwapTotal: It’s the total swap memory reserved.
SwapUsed: It’s the swap used memory by the system, on optimal systems should be 0.
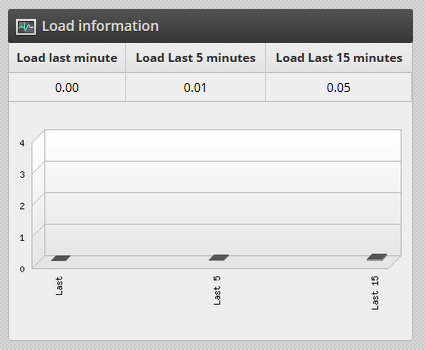
The Load table shows the system load:
The Network Traffic Interfaces table shows the system traffic consumption since last time that the ZenLB was switched on:
