MONITORING::GRAPHS SECTION
This section is useful to monitorize the internal load balancer system to detect problems through the parameters of CPU usage, swap memory, ram memory, all configured nework interfaces, load and hard disk storage.
All the graphs that are shown in the first page are the daily progress value of every parameter. Also, you’ll be able to access to the weekly, mothly and yearly history pressing on the graph selected.
MONITORING::CONNS STATS SECTION
This section provides information about farms.
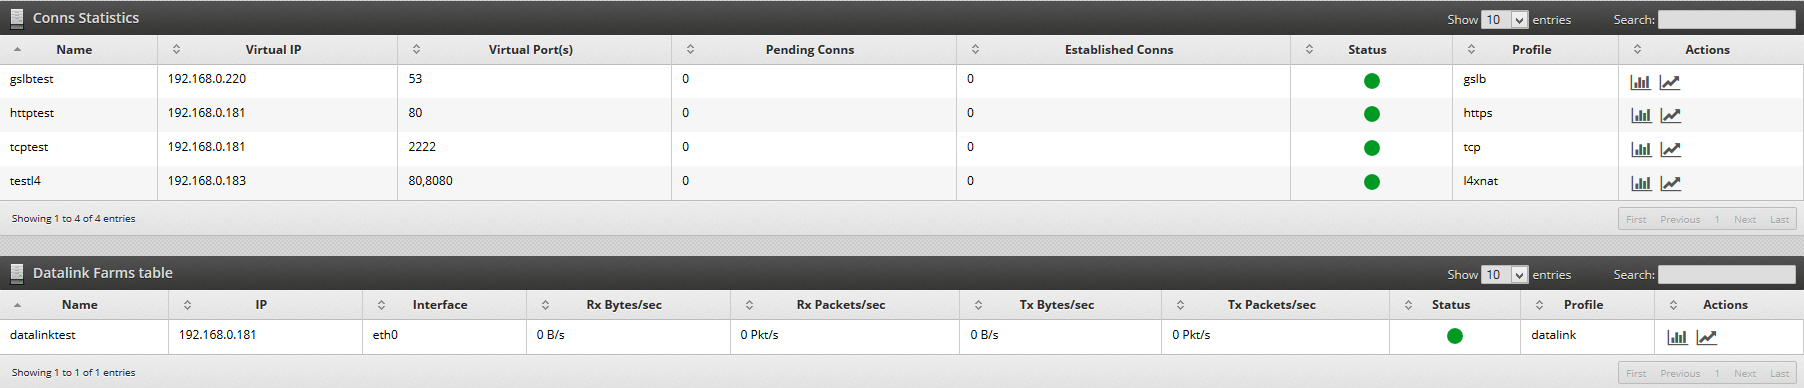
Some parameters displayed:
Pending Conns are calculated with the input SYN requests that are pending to be processed in the system for this farm.
Established Conns are calculated with the input ESTABLISHED requests that are processing currently.
Status field shows the state of the farm system process with a green dot if the farm is up and a red dot if the farm is down.
Profile field shows the profile definition selected at the creation time for the current farm.
Actions field shows the available options for every farm, which could be:

 Show connection graphs: Daily, weekly, monthly and yearly connections graphs will be displayed if this button is pressed.
 Show global status: This action shows the actual state of backends, clients and connections that are being delivered from the virtual service to the real servers.