Farms Graph Stats
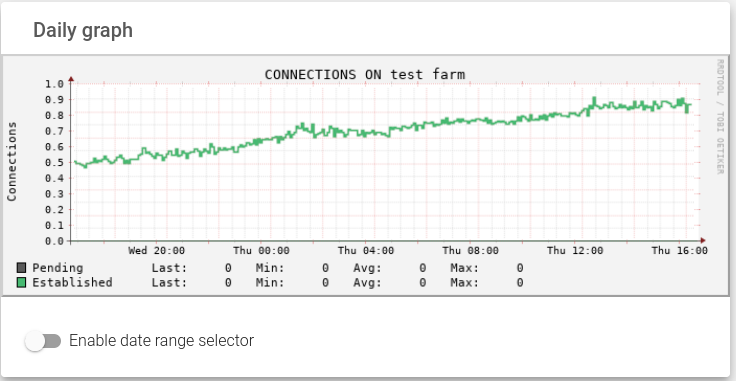
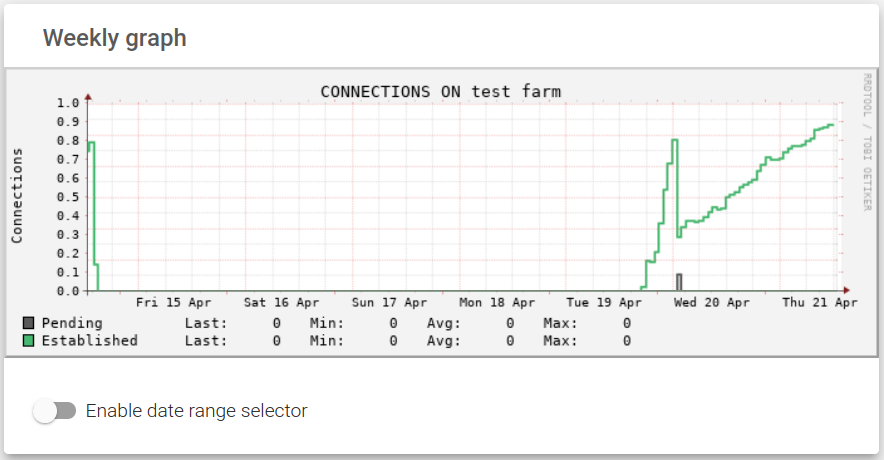
This section shows the monitoring graph history of established and pending connections of current farms in four various periods: last day, last week, last month and last year.
The accounted connections are:
Established. The connections are confirmed and marked as ESTABLISHED. For L4xNAT profile farms, this means there’s a connection to the backend (as it behaves like a router). For HTTP profiled farms this means there’s a connection to the virtual server.
Pending. Connections marked as SYN have not been confirmed yet. An increase means a higher rate of requests received and are not served.
Each graph also indicates the last value gathered, i.e. minimum, maximum and average values, and a flag to select a range in the graph may be used if the Enable data range selector command is activated.
Next step, see the backends stats.